Table of Contents
Understanding the Historic 11-Year July Winning Streak
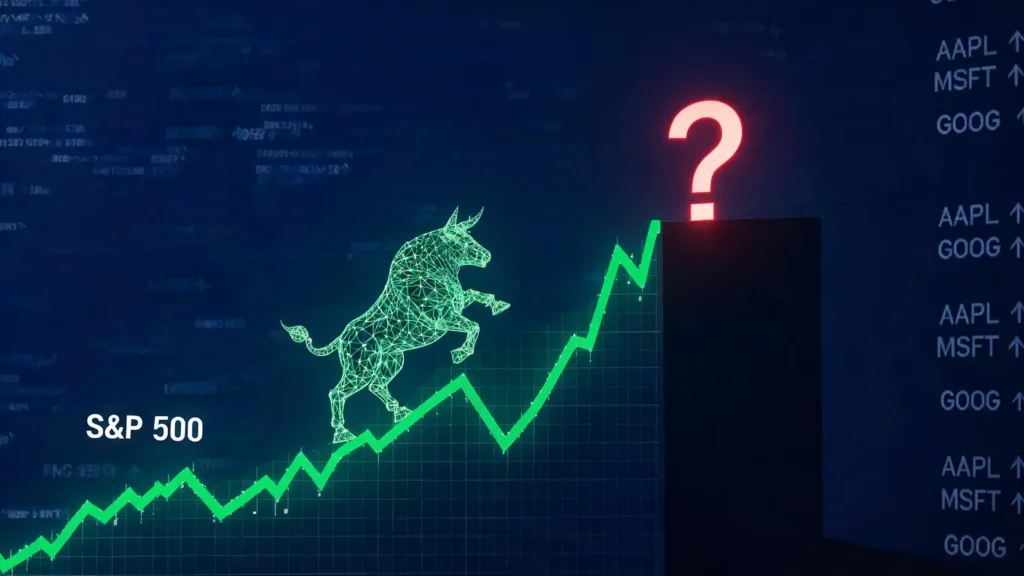
The S&P 500 is currently riding a remarkable S&P 500 11-year July winning streak, a seasonal anomaly that has captivated investors and analysts alike. As we enter July 2026, the dominant question is whether this historic trend can withstand the mounting economic pressures. The market’s resilience is being tested, and understanding the history of the S&P 500’s July performance is crucial for gauging what might come next. This article dissects the streak, the critical factors at play, and what it all means for your portfolio.
A Year-by-Year Look at S&P 500’s July Returns
The consistency of the July rally has been nothing short of extraordinary. For eleven consecutive years, the S&P 500 has delivered positive returns in July, providing a powerful tailwind for investors during the summer months. To truly appreciate this pattern, let’s examine the performance data.
| Year | S&P 500 July Return | Key Market Drivers |
|---|---|---|
| 2015 | +2.0% | Recovery from Greek debt crisis fears; solid earnings. |
| 2016 | +3.6% | Post-Brexit rebound; strong U.S. economic data. |
| 2017 | +1.9% | Tech sector boom; stable global growth. |
| 2018 | +3.6% | Robust corporate earnings; tax cut optimism. |
| 2019 | +1.3% | Fed interest rate cut; easing trade tensions. |
| 2020 | +5.5% | Massive fiscal stimulus; COVID-19 vaccine hopes. |
| 2021 | +2.3% | Continued economic reopening; strong earnings season. |
| 2022 | +9.1% | Peak inflation hopes; bounce from a bearish first half. |
| 2023 | +3.1% | AI-driven tech rally; soft landing narrative gains traction. |
| 2024 | +2.8% | Stable inflation data; resilient consumer spending. |
| 2025 | +3.7% | Expectations of Fed easing; strong tech sector performance. |
The average return during this 11-year period is approximately +3.54%, a significant figure for a single month.
The Last Red July: A Look Back at Market Conditions in 2014
To understand what could break the streak, it’s instructive to look at the last time the S&P 500 fell in July. In July 2014, the index dipped by -1.5%. The market environment then was characterized by a mix of geopolitical turmoil, including rising tensions in Ukraine and the Middle East, and concerns over the eventual end of the Federal Reserve’s quantitative easing program. This serves as a reminder that even strong seasonal trends can be derailed by macroeconomic and geopolitical shocks.
What Are the Key Factors Testing the S&P 500’s July Performance This Year?
While history is on its side, the streak faces one of its most significant challenges in 2026. Several potent economic forces are converging, creating a level of uncertainty not seen in several years. Investors are keenly watching three main areas that will likely determine the S&P 500 forecast for 2026.
The Impact of CPI, Inflation, and Federal Reserve Policy
Inflation remains the central variable. The most recent Consumer Price Index (CPI) reports have shown a stickiness that the market finds unsettling. While headline inflation has moderated from its peaks, core inflation persists above the Federal Reserve’s 2% target. This puts the Fed in a difficult position. Any surprisingly high inflation print in the upcoming July report could force policymakers to maintain their hawkish stance, potentially signaling that interest rates will stay higher for longer. Such a scenario would be a significant headwind for equities, as it dampens economic growth and increases the discount rate used to value future earnings.
How Q2 Corporate Earnings Will Decide the Market’s Fate
The Q2 2026 earnings season, which kicks into high gear this month, is the second major hurdle. With valuations stretched, particularly in the technology sector, corporate profits need to justify the market’s optimism. Analysts will be scrutinizing not just the headline earnings-per-share (EPS) and revenue figures, but also corporate guidance for the second half of the year.
Any signs of margin compression, slowing demand, or cautious outlooks from bellwether companies could trigger a market reassessment. A strong earnings season, on the other hand, could provide the fuel needed to push the market higher and secure a twelfth consecutive winning July. For a deeper dive into market dynamics, our guide on the stock market provides essential context.
Valuation and Yields: Are Stocks Too Expensive to Continue the Rally?
Finally, valuation is a growing concern. The S&P 500’s forward price-to-earnings (P/E) ratio is trading well above its historical average. This suggests that a great deal of good news is already priced in. Complicating matters is the persistent attractiveness of bond yields. With U.S. Treasury yields offering a competitive, lower-risk return, the bar is much higher for stocks to perform.
Investors are constantly weighing the equity risk premium—the excess return stocks are expected to provide over risk-free bonds. If that premium is perceived as too low, capital is likely to rotate from equities to fixed income, putting downward pressure on the S&P 500.
Why Does July Tend to Be a Strong Month for Stocks?
The ‘July Effect’ is a well-documented piece of stock market seasonality. But what are the theories behind this pattern? Is it a reliable phenomenon or just a statistical fluke? Understanding the potential drivers can offer valuable perspective. 📈
The ‘July Effect’: Exploring Theories Behind the Seasonal Strength
Several theories attempt to explain July’s historical strength:
- Start of the Second Half: The beginning of Q3 often sees new capital inflows from institutional investors reallocating their portfolios for the second half of the year.
- Positive Summer Sentiment: A more relaxed, optimistic mood during summer months is thought to translate into greater risk appetite among retail investors.
- Earnings Season Anticipation: July is the start of Q2 earnings season, and markets often rally in anticipation of positive results.
Is It a Statistical Quirk or a Reliable Market Pattern?
Skeptics argue that an 11-year streak, while impressive, is not long enough to be a permanent, ironclad rule. Financial markets are complex, and random chance can produce patterns that appear meaningful. However, the consistency and magnitude of the July returns suggest there may be underlying behavioral or structural factors at play. Professional traders are certainly aware of this seasonal trend, and their positioning can become a self-fulfilling prophecy. Data from derivatives markets, such as the E-mini S&P 500 Options Quotes from CME Group, often show institutional positioning in anticipation of seasonal moves.
How Summer Trading Volumes Influence Market Performance
July is typically a month of lower trading volume as many market participants are on vacation. This ‘thin’ trading environment can have a dual effect. On one hand, it can lead to increased volatility, as a single large order can have an outsized impact. On the other, it can also mean that an established trend faces less resistance. If positive momentum is carrying over from June, the lower volume in July can allow that trend to continue unimpeded, potentially contributing to the positive seasonal bias.
Conclusion
The S&P 500’s 11-year July winning streak is a powerful and compelling historical trend that investors cannot ignore. It provides a bullish backdrop as we enter the month. However, 2026 presents a formidable set of challenges. Stubborn inflation, a hawkish Federal Reserve, and elevated valuations create significant headwinds that could easily halt the streak. The upcoming CPI data and Q2 corporate earnings reports will be the ultimate arbiters.
While the seasonal tailwind is a positive factor, it should be weighed carefully against the fundamental risks. Whether the streak extends to a twelfth year or finally breaks is the most anticipated market event of the summer, and prudent investors should be prepared for either outcome.
Frequently Asked Questions (FAQ)
Q: How many years in a row has the S&P 500 been positive in July?
A: As of the start of July 2026, the S&P 500 has had a positive return in July for 11 consecutive years, from 2015 through 2025.
Q: What was the average return for the S&P 500 during this July winning streak?
A: The average monthly return for the S&P 500 during the 11-year July winning streak (2015-2025) was approximately +3.54%.
Q: What are the main risks to the S&P 500’s performance this July?
A: The primary risks this July are threefold: a higher-than-expected inflation report (CPI) that could lead to a more aggressive Federal Reserve, disappointing Q2 corporate earnings or weak forward guidance, and high stock valuations that make the market vulnerable to a correction.
Q: What is the ‘July Effect’ in stocks?
A: The ‘July Effect’ refers to a historical seasonal tendency for stock markets, particularly the S&P 500, to perform strongly during the month of July. Theories behind it include new capital inflows for the second half of the year, positive investor sentiment, and anticipation of a strong Q2 earnings season.
Q: When was the last time the S&P 500 had a negative July?
A: The last time the S&P 500 recorded a negative return in July was in 2014, when it declined by approximately -1.5% due to geopolitical concerns and shifting expectations about monetary policy.