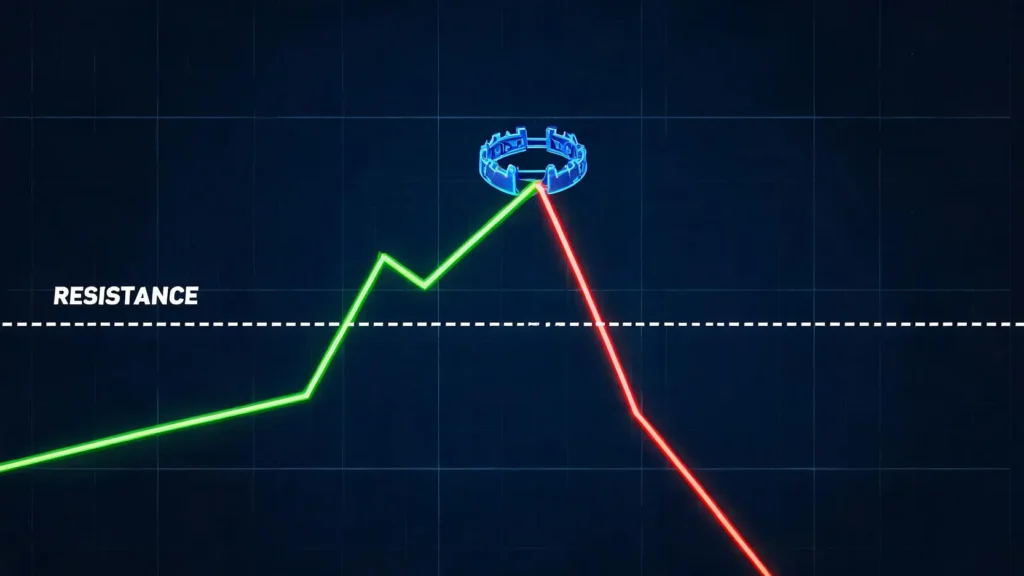
The sting of a promising trade reversing into a loss is a universal frustration for traders. You see a stock punch through a key resistance level, you jump in, and then, moments later, the price collapses back down, leaving you caught in a trap. This costly scenario, known as a false breakout, can erode both capital and confidence. As we navigate the complex market dynamics of 2026, understanding the anatomy of these events is paramount. This guide provides a definitive framework for trading false breakout stocks 2026, detailing not only how to identify false breakouts but also how to implement strategies to avoid them and even profit from the subsequent reversal.
Table of Contents
What Exactly Is a False Breakout in Stock Trading?
A false breakout, or “fakeout,” is a market signal that deceives traders into believing a significant price move is underway when, in fact, the momentum is insufficient to sustain it. A price will momentarily breach a critical support or resistance level, only to quickly reverse course. According to Investopedia, these events often occur at key technical levels where many traders place entry orders and stop-losses, creating a pool of liquidity for larger players to exploit. Recognizing the structure and cause of these traps is the first step toward defending your portfolio.
The Anatomy of a Fakeout: Bull Traps and Bear Traps Explained
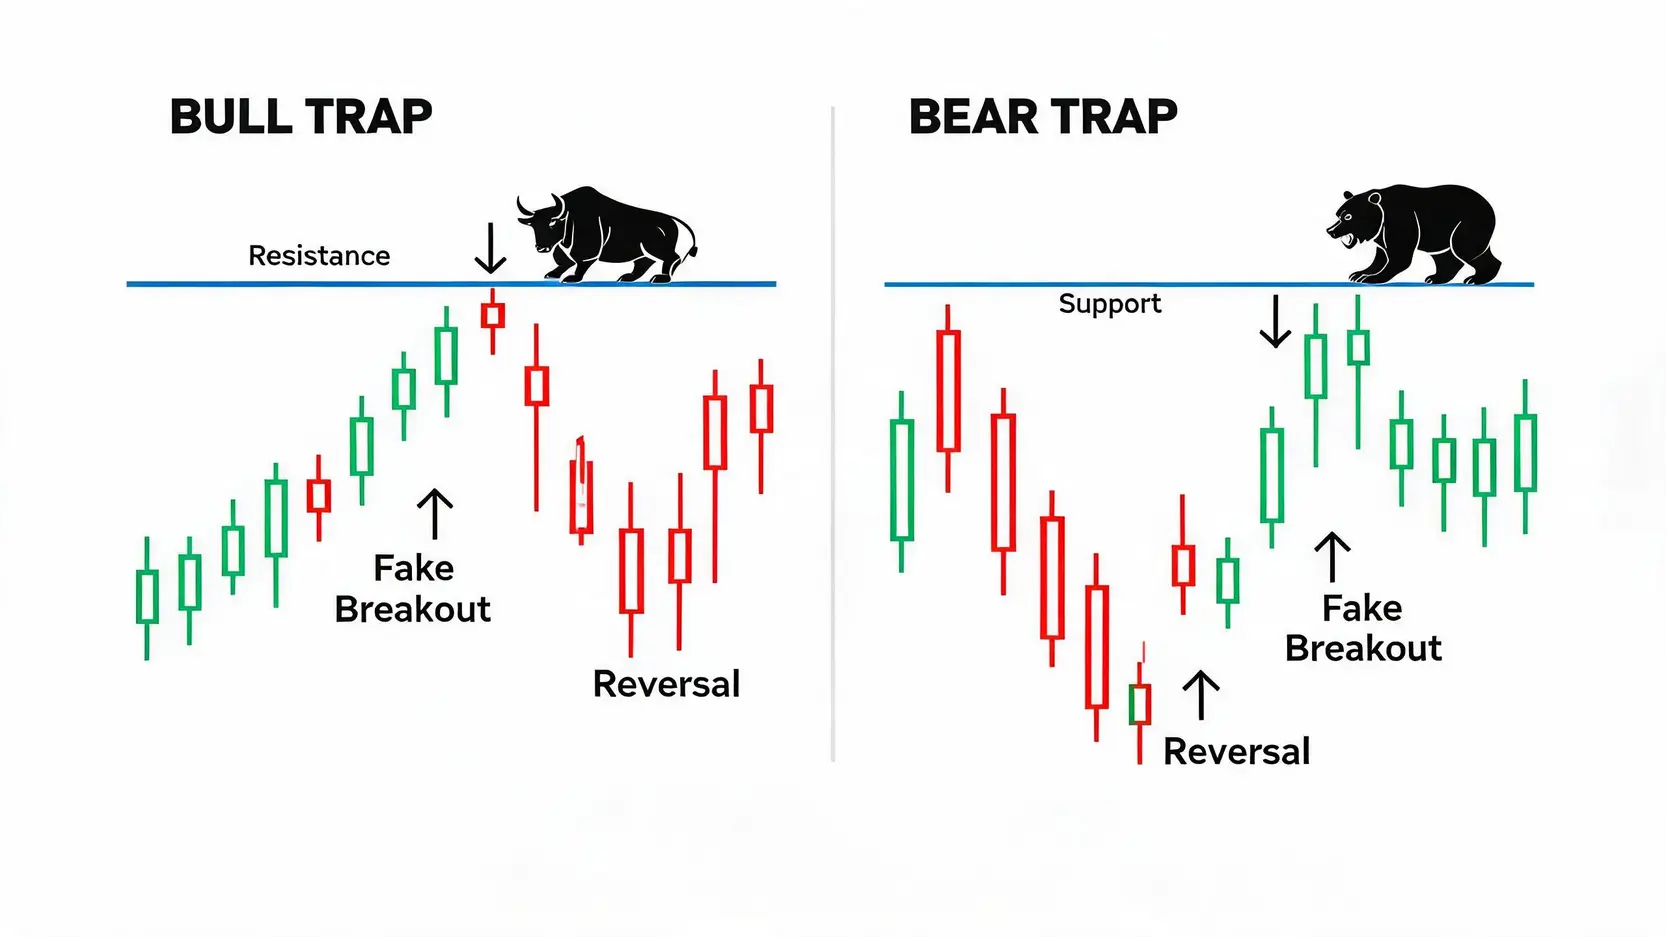
False breakouts manifest in two primary forms, depending on the market direction:
- 🐂 Bull Trap: This occurs during a downtrend or consolidation. The price briefly rallies above a resistance level, luring in optimistic buyers (the “bulls”). Once their buy orders are filled, the price sharply reverses downwards, trapping them in losing long positions. This action often triggers a cascade of stop-loss orders, accelerating the decline.
- 🐻 Bear Trap: Conversely, this happens in an uptrend or consolidation. The price temporarily dips below a support level, tricking sellers (the “bears”) into opening short positions. Soon after, the price reverses and rallies higher, trapping the short-sellers and often forcing them to buy back at a loss, which further fuels the upward momentum.
Why False Breakouts Happen: Low Volume, News Spikes, and Profit-Taking
Several market forces can conspire to create a false breakout. Understanding these catalysts helps in assessing the validity of a price move.
- Low Volume: A breakout occurring on low trading volume is a major red flag. Genuine breakouts are supported by a surge in volume, indicating strong conviction from a large number of market participants. A low-volume move suggests a lack of broad interest, making it vulnerable to a quick reversal.
- News-Driven Spikes: A sudden news headline or economic data release can cause a volatile, knee-jerk reaction in a stock’s price. This initial surge is often driven by algorithms and emotional traders, not sustainable institutional buying. Once the initial excitement fades, the price often retraces its entire move.
- Institutional Profit-Taking: Large institutional players may push a price just beyond a well-known resistance level to trigger the buy orders of retail breakout traders. They then use this influx of buying liquidity to sell their large positions at a favorable price, causing the price to fall back into its range.
Real-Life Example: Analyzing a Recent False Breakout Case
Consider a hypothetical stock, ‘NextGen AI,’ trading in a range between $150 and $175 for several weeks in early 2026. The $175 level is a clear resistance. One afternoon, the company announces a minor partnership. The stock price shoots up to $178 on an initial burst of activity. Breakout traders jump in, anticipating a run to $200. However, observing the volume indicator, the spike is significantly lower than previous high-volume days. Within the hour, the price drifts back to $174, and by the next day, it’s trading at $165. This was a classic bull trap, fueled by a minor news catalyst and insufficient volume to sustain the move.
Key Indicators to Differentiate a Real Breakout from a False One
Distinguishing between a genuine move and a fakeout requires a multi-faceted approach. Relying on price alone is a recipe for disaster. Instead, a disciplined trader cross-references the breakout with several key indicators to confirm its strength and legitimacy. This process of confirmation is central to avoiding costly trading traps.
The Critical Role of Trading Volume Confirmation
Volume is arguably the most crucial confirmation tool. A true breakout should be accompanied by a significant increase in trading volume—ideally 1.5 to 2 times the recent average. This surge signifies strong institutional participation and conviction behind the move. A breakout on weak or declining volume is a classic characteristic of a false breakout. It suggests that the move lacks the buying or selling pressure needed to continue, making it highly susceptible to a reversal. Always wait for the volume to support the price action.
Using RSI and MACD Divergence to Spot Weakness
Momentum oscillators like the Relative Strength Index (RSI) and Moving Average Convergence Divergence (MACD) are invaluable for spotting hidden weakness in a trend. A divergence occurs when the price makes a new high, but the oscillator fails to make a corresponding new high. This is known as a bearish divergence and signals that the upward momentum is waning, increasing the likelihood of a failed breakout or reversal. Conversely, if the price makes a new low but the oscillator makes a higher low (bullish divergence), it suggests that selling pressure is diminishing, and a breakdown may be false. For more on this, explore our guide on Coppock Curve vs RSI: Which Indicator Is Better for Trend….
Reading the Clues in Candlestick Patterns
Candlestick patterns provide a visual narrative of the battle between buyers and sellers at critical price levels. Certain patterns appearing at a breakout point can serve as powerful warning signs of a potential fakeout:
- Doji or Spinning Top: These candles have small bodies and long wicks, indicating indecision. If one appears after a supposed breakout, it shows that conviction has immediately stalled.
- Pin Bar (or Hammer/Shooting Star): A candle with a long wick that “pokes” through a support/resistance level but closes back within the previous range is a strong rejection signal. A long upper wick (Shooting Star) at resistance is a bearish sign, while a long lower wick (Hammer) at support is bullish.
- Engulfing Patterns: A large bearish engulfing candle that completely negates the breakout candle from the previous period is a very strong sign that the breakout has failed and sellers have taken control.
A Trader’s Playbook: Proactive Strategies for 2026
Successfully navigating markets prone to false breakouts requires more than just identification; it demands a proactive and disciplined strategic playbook. The goal is not just to avoid traps but to maintain capital and, in some cases, capitalize on the very volatility that catches others off guard. The following strategies are designed to build resilience and precision into your trading approach for the 2026 market environment.
Strategy 1: The ‘Wait and Confirm’ Approach to Avoid Entry Traps
Patience is the ultimate defense against fakeouts. Instead of entering a trade the moment a price pierces a support or resistance level, adopt a confirmation-based entry model. This involves waiting for additional evidence that the breakout is genuine.
- Wait for the Candle Close: A common technique is to wait for the trading session’s candle (e.g., a 1-hour, 4-hour, or daily candle) to close decisively beyond the breakout level. A price can spike through a level intra-day but fail to hold those gains by the close.
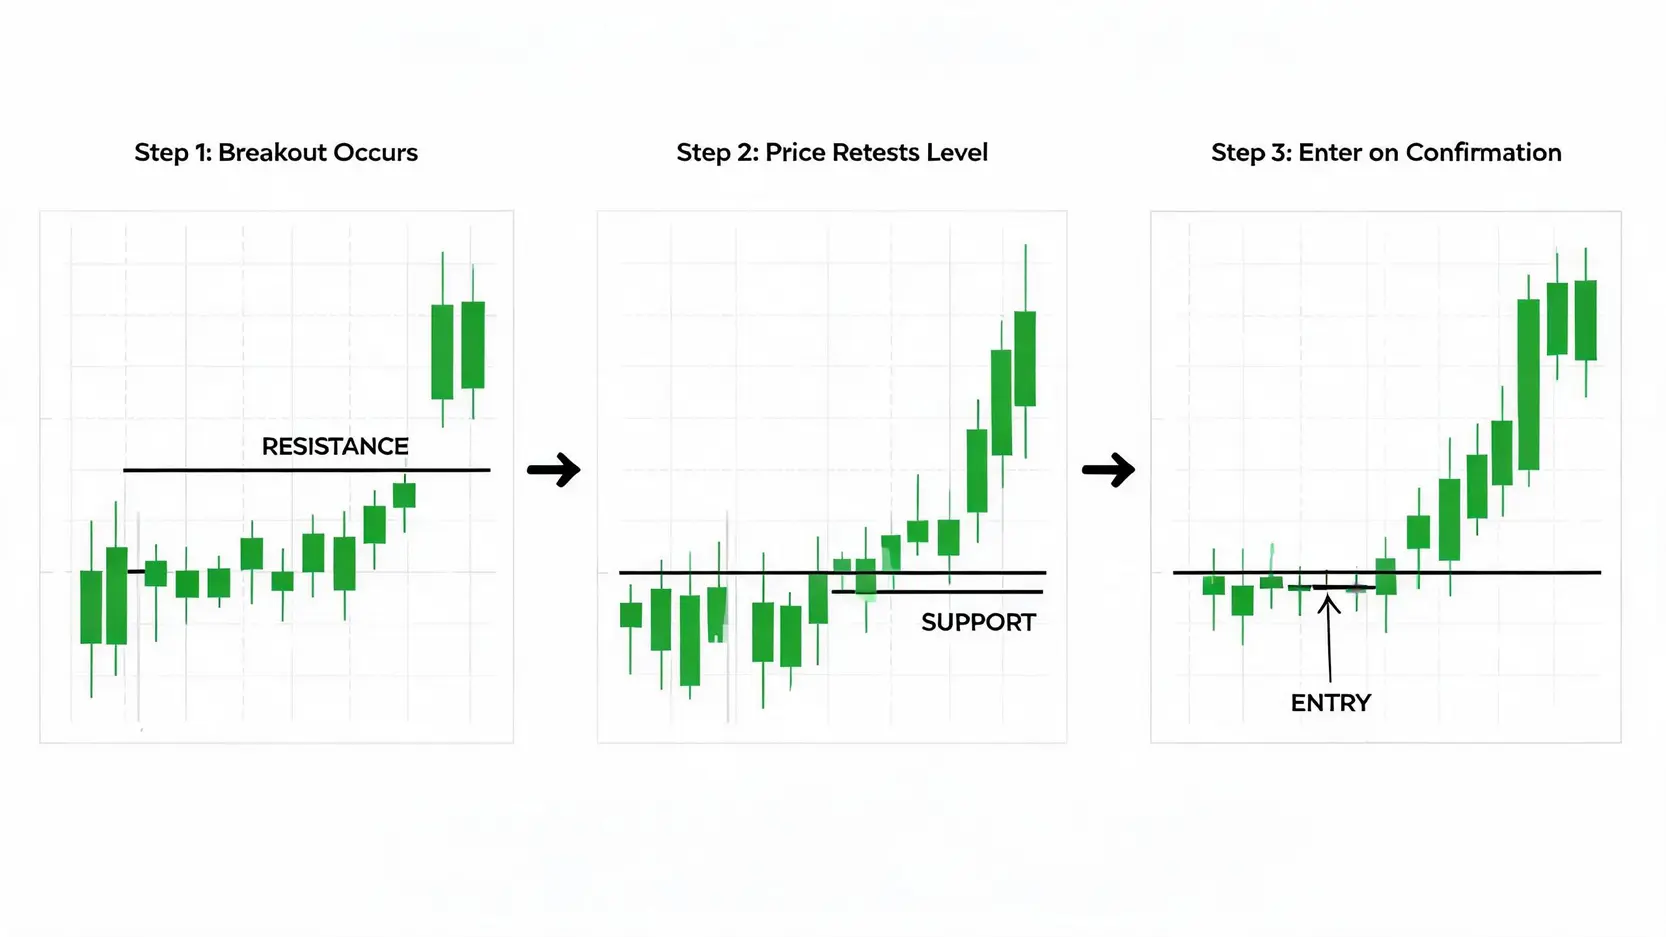
- The Retest Confirmation: A very reliable signal occurs when the price breaks out, then pulls back to “retest” the former resistance (which should now act as support) before continuing its upward trajectory. Entering on the successful retest offers a much higher probability of success and a clear level to set a stop-loss.
Strategy 2: How to Trade the Reversal After a False Breakout is Confirmed
For more experienced traders, a confirmed false breakout can present a high-probability trading opportunity in the opposite direction. Once a bull trap is identified (price breaks above resistance and then closes strongly back below it), it signals that sellers have overwhelmed the buyers. A short position can be initiated with a stop-loss placed just above the high of the fakeout. Similarly, a confirmed bear trap offers a powerful buying opportunity. This contrarian strategy leverages the trapped traders who will be forced to exit their positions, adding fuel to the reversal move.
Setting Smart Stop-Loss Orders to Mitigate False Breakout Risk
Effective risk management is non-negotiable. A stop-loss order is your primary insurance policy. However, placing it too close to the breakout level makes it vulnerable to normal market volatility and potential stop-hunting. Instead, use a volatility-based placement method, such as placing your stop below the low of the breakout candle or using the Average True Range (ATR) indicator to set a logical distance from your entry. Proper stop-loss placement ensures that if a breakout does fail, the resulting loss is contained and manageable. Learn more about how to set smart stop loss orders in our advanced guides.
Potential Market Sectors Prone to Volatility and False Breakouts in 2026
Looking ahead in 2026, certain sectors are likely to exhibit higher volatility, making them fertile ground for false breakouts. Traders should be especially cautious and disciplined when trading stocks in these areas:
- Artificial Intelligence (AI): With rapid innovation and hype cycles, AI stocks are prone to news-driven spikes that can easily reverse.
- Biotechnology: Clinical trial results and regulatory news can cause enormous price gaps and subsequent reversals as the market digests the information.
- Cryptocurrency-Related Equities: Stocks with high correlation to digital assets inherit their characteristic volatility, leading to frequent and dramatic fakeouts.
- Renewable Energy: Policy changes and technological breakthroughs create a speculative environment where breakouts often lack the fundamental support to be sustained.
Conclusion
Mastering the art of navigating false breakouts is a hallmark of a mature trader. It transforms a common point of frustration into an opportunity for disciplined analysis and strategic advantage. The core message is clear: patience and confirmation are your greatest allies. By prioritizing the validation of a breakout through volume, momentum indicators, and candlestick patterns, you shift the odds in your favor. Coupled with a robust risk management strategy—especially intelligent stop-loss placement—you can protect your capital from the inherent volatility of the 2026 market. Apply these principles to cultivate a more disciplined, resilient, and ultimately successful trading approach.
Frequently Asked Questions about False Breakouts
Q: How long does a false breakout typically last?
A: A false breakout is usually a swift event. The rejection and reversal often happen within one to three trading sessions (candlesticks) of the initial breakout. If a price breaks a level and manages to hold and consolidate above it for several sessions, the probability that it’s a genuine breakout increases significantly.
Q: Can false breakouts occur in any market (stocks, forex, crypto)?
A: Absolutely. False breakouts are a universal market phenomenon based on trader psychology and order flow. They occur in any freely traded market, including stocks, forex, commodities, and cryptocurrencies. The principles for identifying and avoiding them are consistent across all asset classes.
Q: What is the single most important indicator for avoiding false breakouts?
A: While no single indicator is foolproof, trading volume is widely considered the most critical confirmation tool. A breakout with high, confirmatory volume has a much higher chance of success than one with low or average volume. Always analyze volume in conjunction with price action.
Q: Are false breakouts more common in bull or bear markets?
A: False breakouts can occur in any market condition, but their nature might differ. In choppy, range-bound markets, they are very common as the price tests the boundaries of the range. In strong bear markets, bull traps (false upward breakouts) can be frequent as traders optimistically buy into short-lived relief rallies.