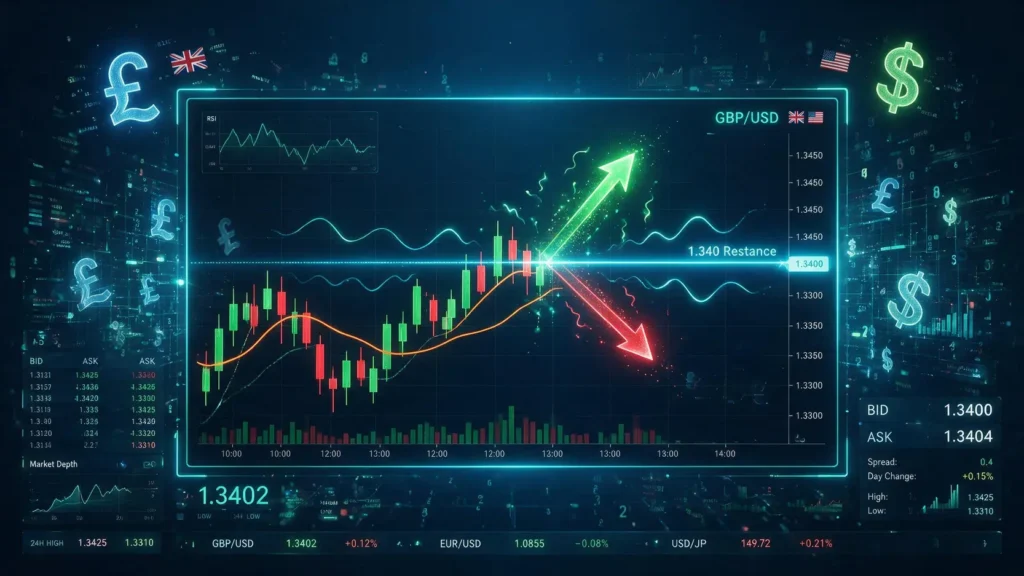
The GBP/USD currency pair is currently testing the critical GBP/USD 1.34 resistance, a formidable ceiling that has historically stifled bullish momentum. This pivotal moment presents both a significant obstacle and a profound opportunity for astute traders. This guide delivers a comprehensive GBP/USD technical analysis of this key resistance level, exploring the crucial indicators and strategic frameworks required to navigate the potential outcomes and identify the market’s next directional bias. Understanding the key resistance and support levels is paramount for success.
Table of Contents
Understanding the Significance of the 1.34 Resistance Level
In forex trading, price levels are not arbitrary; they represent a collective market psychology of supply and demand. The 1.34 zone for GBP/USD is a battleground where selling interest has consistently overwhelmed buying pressure, making it a critical area to watch for any trader involved with this pair.
What is a Resistance Level in Forex Technical Analysis?
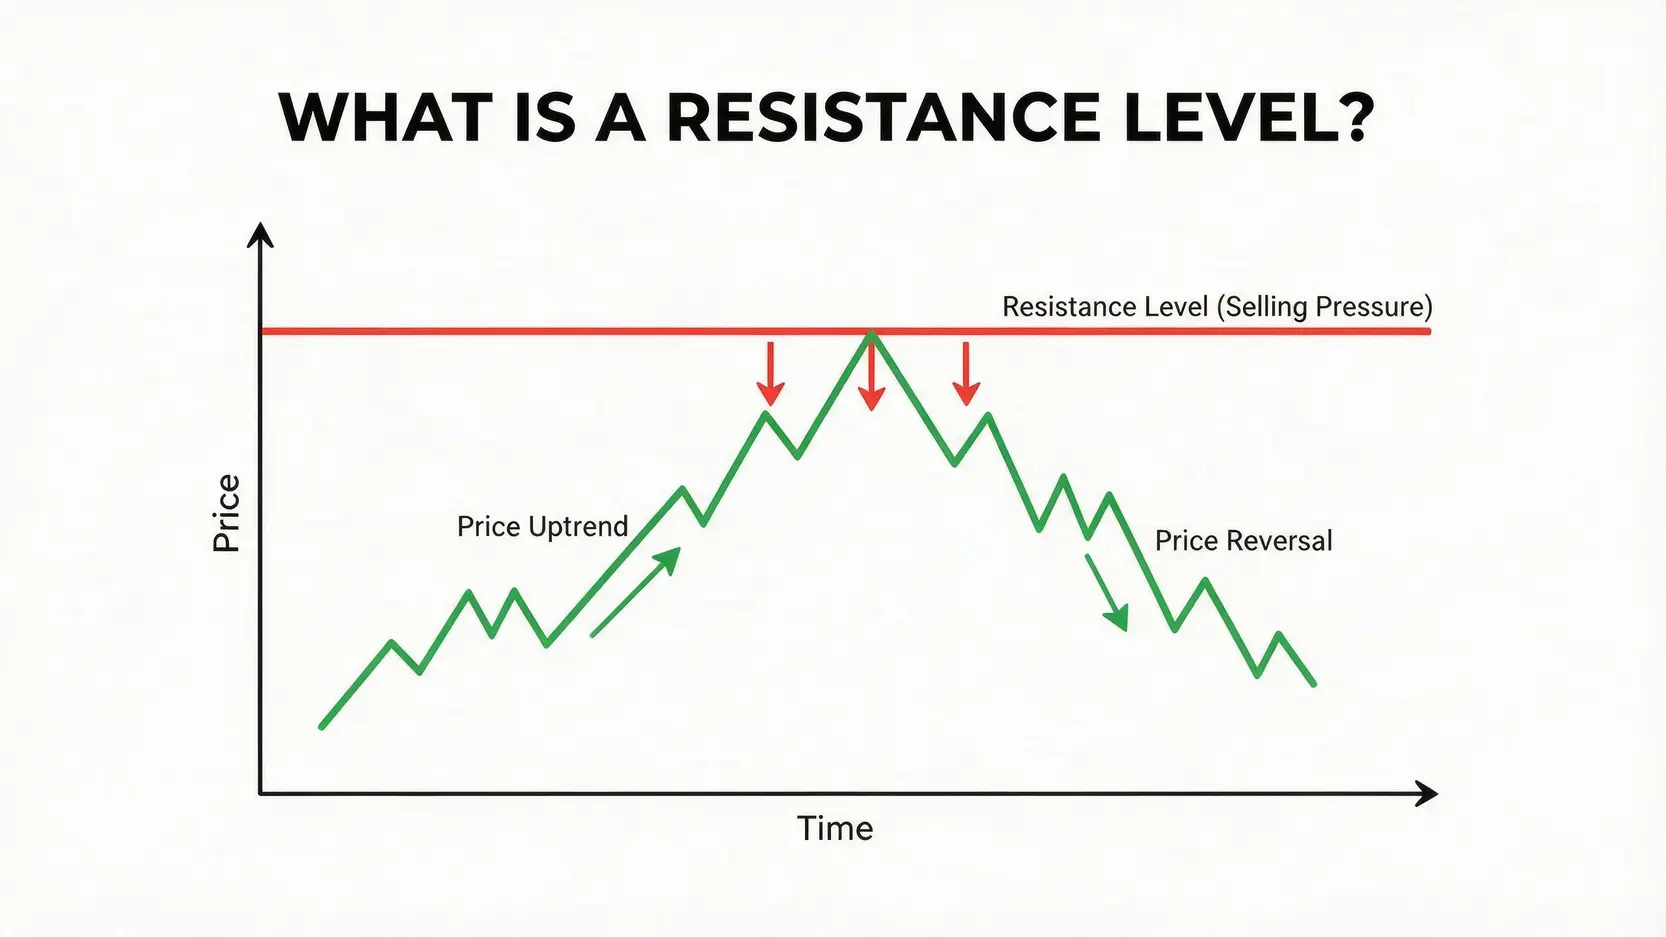
A resistance level is a price point on a chart where a rising price is expected to pause or reverse. It acts as a ceiling because the number of sellers at this level is greater than the number of buyers, thus halting the price advance. This selling pressure can be due to a variety of factors, including profit-taking by traders who bought at lower levels or the initiation of new short positions by those who believe the asset is overvalued. A convincing break above a resistance level indicates a significant shift in market sentiment, suggesting that the bulls have absorbed all the selling pressure and are now in control. Following a breakout, a former resistance level often transforms into a new support level.
Historical Price Action: Why 1.34 is a Major Hurdle for GBP/USD
The 1.3400 level is not just a random number; it’s a psychologically significant barrier fortified by repeated historical interactions. Throughout late 2024 and 2025, this zone acted as a major distribution area, where rallies lost steam and significant downturns began. Each test and failure to breach this level has reinforced its validity as a supply zone. This historical context means that a large volume of sell orders is likely clustered around this area, creating a formidable wall of resistance. Traders remember these past failures, which influences their current decisions and adds to the level’s strength.
Core Technical Indicators to Monitor at the GBP/USD 1.34 Zone
When a major currency pair like GBP/USD approaches a key inflection point like the 1.34 resistance, relying on a single indicator is insufficient. A confluence of signals across different technical tools provides a much more robust and reliable picture of the underlying market dynamics. Here are the core indicators traders should be monitoring.
The Role of the 200-Day Moving Average (200DMA) as Confluent Resistance
The 200-Day Moving Average (200DMA) is one of the most widely watched technical indicators, serving as a long-term trend gauge. When the price is trading below the 200DMA, the market is generally considered to be in a long-term downtrend, and the moving average itself often acts as a dynamic resistance level. If the static horizontal resistance at 1.34 converges with a downward-sloping 200DMA, it creates a powerful area of confluent resistance. This combination significantly increases the probability of a bearish rejection, as it represents both historical selling pressure (1.34 level) and long-term bearish momentum (200DMA).
Reading the Momentum: RSI, Stochastic, and MACD Signals
Momentum oscillators are crucial for assessing the strength of a trend and identifying potential exhaustion. As GBP/USD challenges the 1.34 resistance, these indicators can provide early warnings of a potential reversal.
- Relative Strength Index (RSI): The Relative Strength Index (RSI) is a momentum oscillator that measures the speed and change of price movements. A reading above 70 is typically considered ‘overbought’. If the RSI is in overbought territory as the price hits 1.34, it suggests that the bullish momentum is waning and the pair is vulnerable to a pullback. Furthermore, a bearish divergence—where the price makes a new high but the RSI makes a lower high—is a powerful reversal signal.
- Stochastic Oscillator: Similar to the RSI, the Stochastic Oscillator compares a particular closing price of an asset to a range of its prices over a certain period. A reading above 80 indicates an overbought condition. If the Stochastic lines (%K and %D) cross downwards from the overbought region, it provides a sell signal that can confirm the resistance at 1.34 is holding.
- MACD (Moving Average Convergence Divergence): The MACD indicator consists of two moving averages and a histogram. A bearish crossover, where the MACD line crosses below the signal line, especially when the histogram is declining, indicates that bearish momentum is increasing. This signal, occurring near the 1.34 resistance, would add significant weight to the case for a reversal.
Strategic Framework: How to Trade the GBP/USD 1.34 Resistance
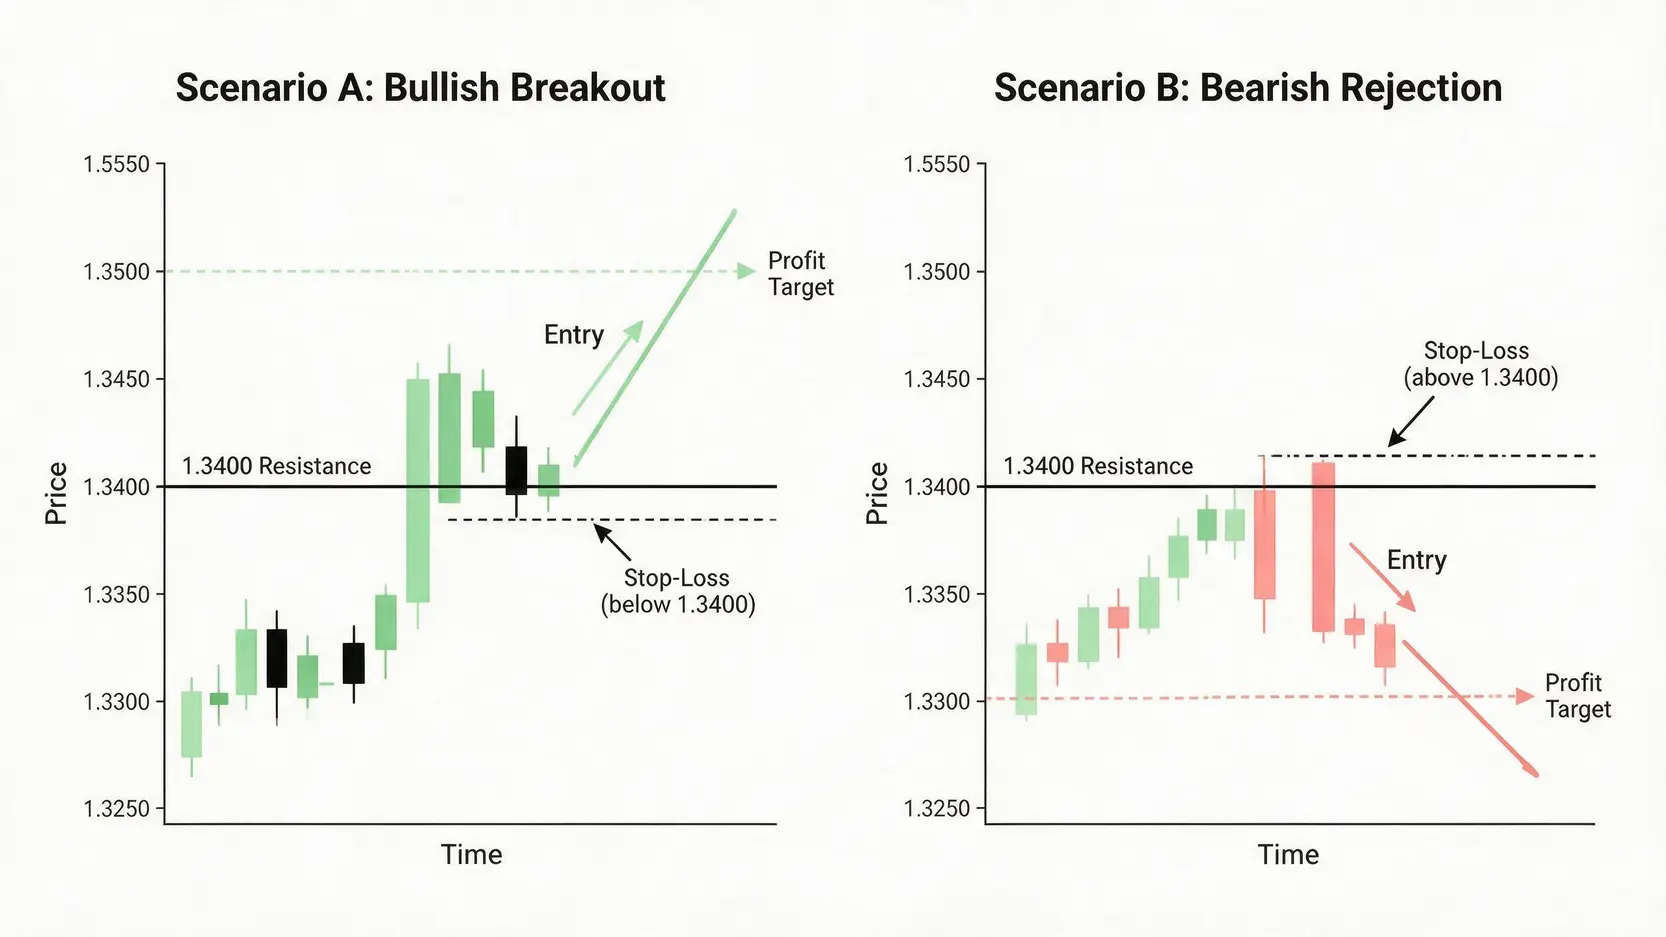
Trading around a pivotal level like 1.34 requires a clear and disciplined strategic framework. Rather than predicting the outcome, professional traders prepare for both possibilities: a bullish breakout or a bearish rejection. A well-defined plan with specific entry triggers, profit targets, and stop-loss levels is essential for navigating the potential volatility.
Scenario A: Trading a Bullish Breakout and Confirmation Above 1.34
A breakout strategy is for traders who believe the bullish momentum is strong enough to overcome the historical selling pressure. However, it’s crucial to avoid entering prematurely on a ‘false breakout’. A valid breakout requires confirmation.
- Entry Trigger: A decisive daily candle close above the 1.3450 level. This buffer helps to filter out noise. An even more conservative approach is to wait for a retest of the broken 1.3400 level, where it should now act as support. A bullish bounce off this retest provides a high-probability entry point.
- Profit Targets: Once the breakout is confirmed, the next logical resistance levels become the targets. These could be previous swing highs or psychological levels, such as 1.3500, followed by 1.3580 and 1.3650.
- Stop-Loss: The stop-loss should be placed below the breakout confirmation point. For instance, if entering on a retest, the stop could be placed below the low of the bounce candle, perhaps around 1.3370, to invalidate the bullish scenario.
Scenario B: Strategies for a Bearish Rejection and Reversal
A rejection strategy is based on the premise that the historical resistance will hold true once again. This scenario is often signaled by specific price action patterns and confirmed by momentum indicators.
- Entry Trigger: Look for classic bearish reversal candlestick patterns on the daily or 4-hour chart, such as a Pin Bar (long upper wick), a Bearish Engulfing pattern, or an Evening Star formation right at the 1.3400-1.3420 zone. Confirmation from an overbought RSI or a bearish MACD crossover strengthens the signal.
- Profit Targets: Initial targets for a short position would be the nearest support levels. These might include the recent swing low around 1.3300, followed by the more significant support zone at 1.3220.
- Stop-Loss: A logical stop-loss would be placed just above the high of the rejection candle or the highest point of the test of resistance, for example, at 1.3460. This ensures that if the resistance does break, the loss is contained.
Risk Management: Setting Effective Stop-Loss and Take-Profit Levels
Regardless of the chosen scenario, effective risk management is the cornerstone of successful trading. The 1% rule is a prudent guideline, where no single trade risks more than 1% of your trading capital. Position sizing should be calculated based on your stop-loss distance. For example, if your stop-loss is 50 pips, your position size should be adjusted so that a 50-pip loss equals 1% of your account balance. Take-profit levels should be set to ensure a positive risk-to-reward ratio, ideally 1:1.5 or higher. This means your potential profit should be at least 1.5 times your potential loss.
Frequently Asked Questions (FAQ) about GBP/USD Trading
Q: What are the next major resistance levels for GBP/USD above 1.34?
A: Should GBP/USD achieve a confirmed breakout above 1.34, the next significant resistance levels to monitor are the psychological barrier at 1.3500, followed by the swing highs from late 2025 around 1.3580, and the major structural resistance near 1.3650.
Q: How does the US Dollar’s strength affect the GBP/USD at this resistance?
A: The value of GBP/USD is a direct relationship between the British Pound and the US Dollar. A weakening US Dollar (as measured by the DXY index) would provide a tailwind for GBP/USD, making a breakout above 1.34 more likely. Conversely, a surge in US Dollar strength, perhaps due to strong economic data or a hawkish FOMC, would act as a headwind and increase the chances of a rejection at the 1.34 resistance.
Q: Is the current economic data supporting a break or a rejection at 1.34?
A: This depends on the latest releases from both the UK and the US. If UK inflation and GDP data are surprisingly strong while US data is weakening, it would support a bullish breakout. However, if the Bank of England (BoE) strikes a dovish tone and the Federal Reserve (FOMC) remains hawkish, the fundamental picture would favor a bearish rejection from the 1.34 resistance.