
The USD/CAD exchange rate is currently testing the critical USD/CAD 1.4000 support, a significant psychological and technical juncture for traders in mid-2026. This level represents a major battleground, and its outcome could dictate the trend for months to come. This article provides a deep-dive analysis into whether the 1.4000 support will hold, offering detailed price forecasts based on the 1.4000 level and a thorough technical analysis of the 1.4000 psychological level. We will explore what key indicators are signaling and how to strategically position your trades in this volatile environment.
Table of Contents
The Historical and Psychological Importance of the 1.4000 Handle
Understanding the significance of the 1.4000 level requires looking at both its past performance and the underlying psychology that governs forex markets. It’s not just another number on the chart; it’s a landmark that has historically commanded the market’s attention.
A look back: How 1.4000 has acted as a major pivot point in the past
Throughout its history, the USD/CAD pair has repeatedly interacted with the 1.4000 level. During periods of significant economic divergence or shifts in commodity prices, this handle has acted as a powerful pivot. In previous years, it has served as both a formidable resistance ceiling and a resilient support floor. For instance, during past oil price slumps, bulls have often mounted a defense here, while in times of Canadian economic strength, bears have targeted this level to confirm a downtrend. Each test of 1.4000 leaves a memory in the market’s collective consciousness, reinforcing its importance for future price movements.
Why round numbers matter in Forex trading psychology
In the world of trading, round numbers like 1.4000, 1.5000, or 1.0000 carry immense psychological weight. This phenomenon is rooted in human nature’s preference for simplicity. Traders, analysts, and even automated systems are often programmed to place orders—including entry, stop-loss, and take-profit orders—around these clean figures. This clustering of orders creates natural zones of high liquidity, which can repel price or, if breached, lead to an accelerated move. Mastering the nuances of Forex trading psychology is about understanding that these levels act as self-fulfilling prophecies; because everyone is watching them, they become critical.
Current Technical Outlook: Gauging the Strength of the 1.4000 Support
As of July 2026, the battle for the 1.4000 support is intensifying. A close examination of the charts reveals a complex picture, with arguments to be made for both a bullish bounce and a bearish breakdown. Let’s dissect the technical signals to form a coherent outlook.
Price Action Analysis: Bullish and Bearish Scenarios on the Daily Chart
On the daily timeframe, price action is showing signs of indecision. We can observe several scenarios:
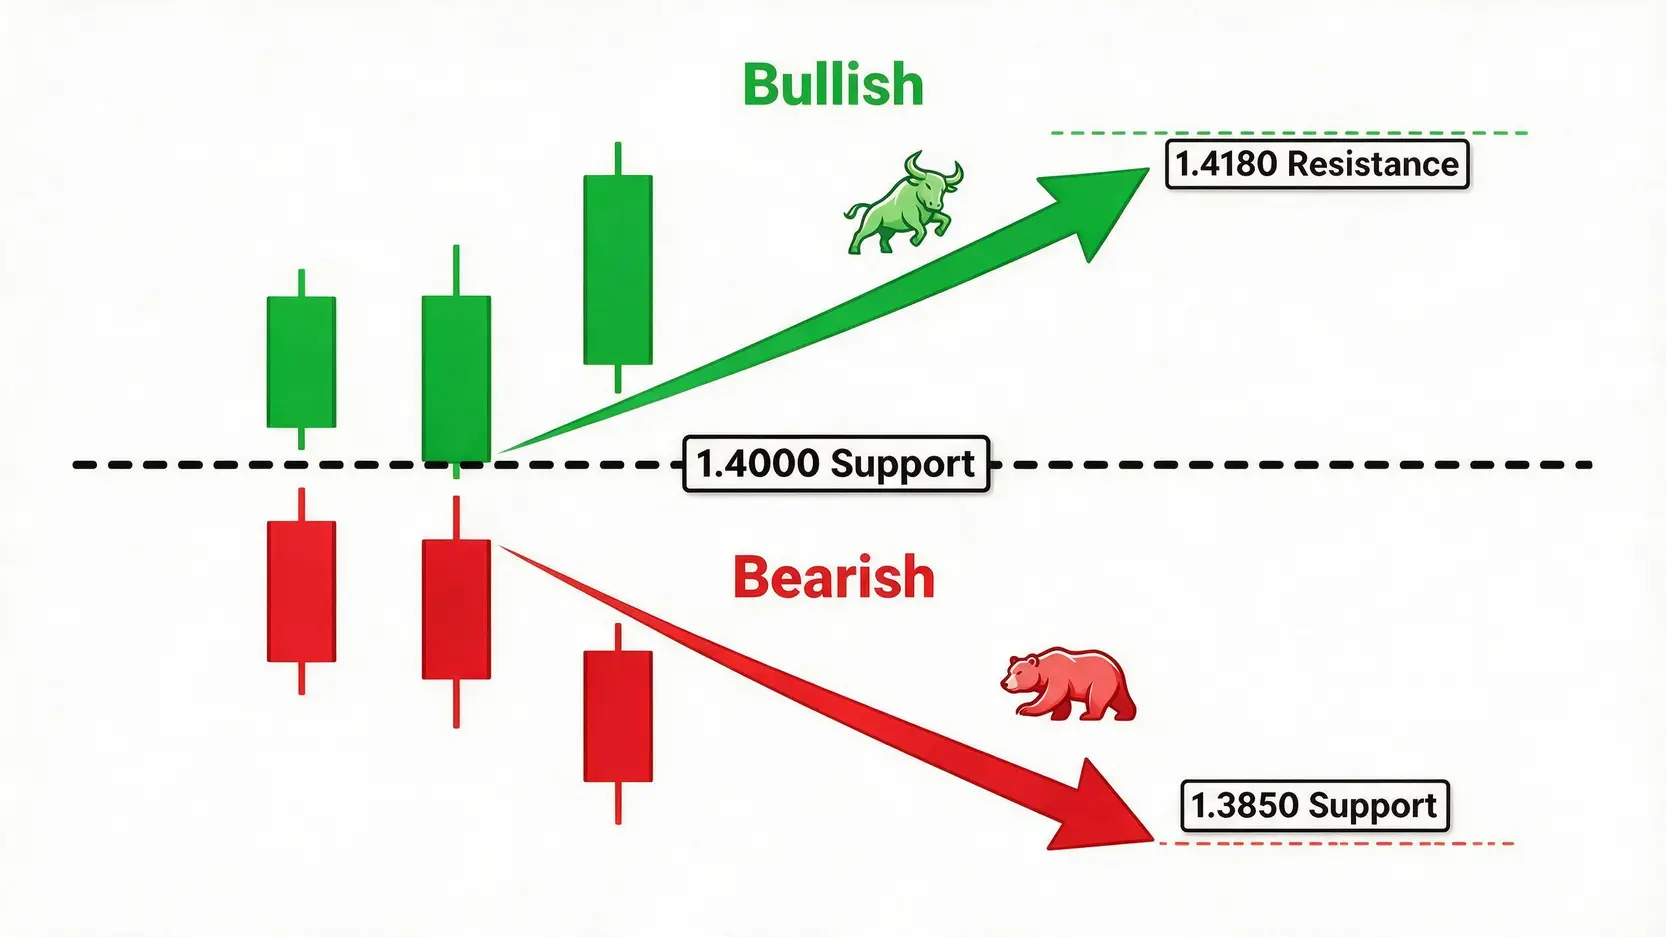
- Bullish Scenario 🐂: If the 1.4000 support holds, we would look for the formation of bullish reversal patterns such as a Hammer, a Bullish Engulfing candle, or a Double Bottom. A strong rejection from this level, confirmed by a daily close well above 1.4000, would signal that buyers are stepping in with force.
- Bearish Scenario 🐻: Conversely, a sustained break below 1.4000 would be a significant victory for the bears. A daily candle closing decisively below this line, especially with increased volume, would likely invalidate the support and open the door to further downside. Traders should watch for a potential retest of the broken 1.4000 level as new resistance before a continuation lower.
Key Indicator Signals: What are the Moving Averages and RSI telling us?
Technical indicators provide additional context to the ongoing price action:
- Moving Averages (MA): The 200-day Simple Moving Average (SMA), a long-term trend indicator, is currently hovering around the 1.3850 area, suggesting it could act as the next major support if 1.4000 gives way. The shorter-term 50-day and 100-day MAs are beginning to slope downwards, indicating weakening bullish momentum. A ‘death cross’ (50-day MA crossing below the 200-day MA) would be a strong long-term bearish signal.
- Relative Strength Index (RSI): The 14-day RSI is approaching the 30.0 oversold territory. While this doesn’t guarantee a bounce, it suggests that the recent bearish momentum is becoming exhausted. A bullish divergence, where the RSI forms a higher low while the price forms a lower low, would be a powerful signal for a potential reversal to the upside.
Potential Price Targets if Support Holds vs. If It Breaks
Based on the technical structure, we can outline potential price targets for both outcomes:
| Scenario | Condition | Primary Target | Secondary Target |
|---|---|---|---|
| Bullish Bounce | Daily close above 1.4050 | 1.4180 (Previous Resistance) | 1.4300 (Psychological Level) |
| Bearish Breakdown | Daily close below 1.3980 | 1.3850 (200-Day SMA) | 1.3700 (Major Support Zone) |
🆕 Fundamental Drivers: What Macro Factors Could Invalidate the 1.4000 Support?
While technicals provide the map, fundamentals provide the fuel. Several macroeconomic factors could either reinforce the 1.4000 support or shatter it completely. Ignoring them would be a critical error in judgment.
The Impact of Oil Prices (WTI) on the Canadian Dollar
Canada is a major oil exporter, making its currency, the Canadian Dollar (CAD), highly sensitive to fluctuations in crude oil prices. Typically, a strong inverse correlation exists between WTI crude oil and the USD/CAD pair. As an authoritative source from Investopedia points out, when oil prices rise, it increases the value of Canada’s exports, leading to a stronger CAD (and a lower USD/CAD). In the current 2026 context, if oil prices continue their recent slide due to global growth concerns, the CAD could weaken significantly, providing strong tailwinds for USD/CAD to break above 1.4000.
Diverging Monetary Policies: Bank of Canada (BoC) vs. The Federal Reserve (Fed)
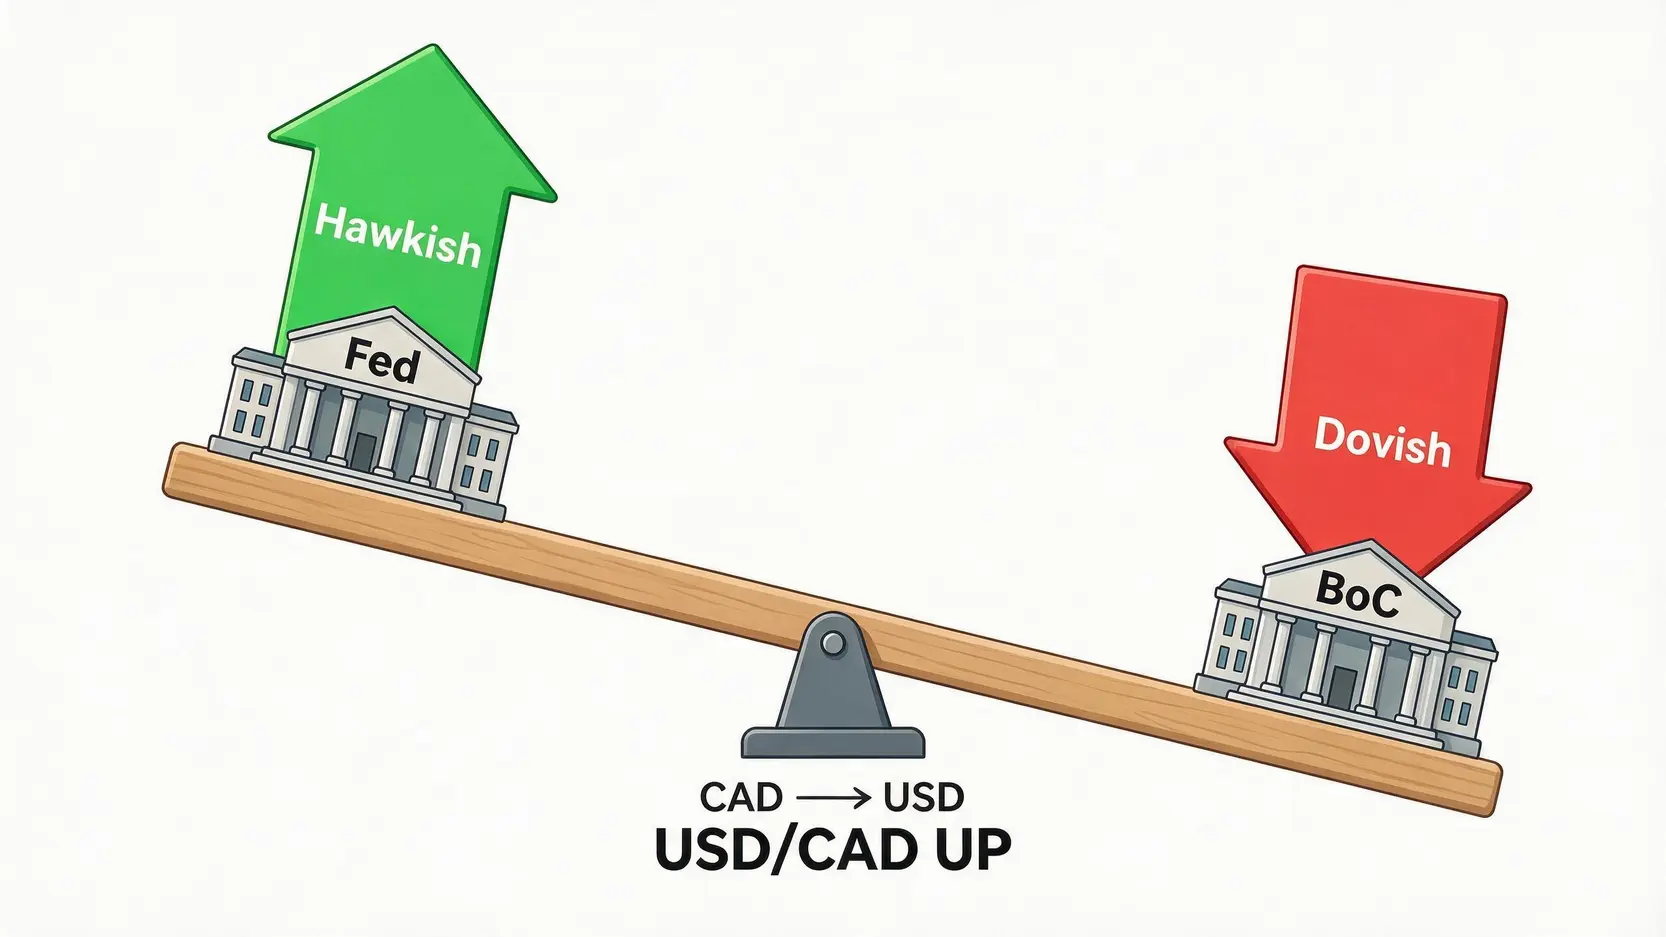
The monetary policy divergence between the Bank of Canada and the U.S. Federal Reserve is perhaps the most potent driver. As of mid-2026, the Fed maintains a hawkish stance, keeping interest rates elevated to ensure inflation remains anchored. In contrast, the BoC has signaled a more dovish tilt, expressing concerns over a slowing domestic economy. This interest rate differential makes holding U.S. Dollars more attractive than Canadian Dollars, creating upward pressure on the USD/CAD pair. Any further dovish commentary from the BoC or hawkish surprises from the Fed could easily invalidate the 1.4000 support.
Upcoming Economic Data to Watch from Canada and the U.S. 🗓️
Traders must keep a close eye on the economic calendar. Key data releases can act as catalysts for major moves:
- From the U.S.: Non-Farm Payrolls (NFP), Consumer Price Index (CPI), and Retail Sales data will be crucial. Stronger-than-expected figures will bolster the Fed’s hawkish case and push USD/CAD higher.
- From Canada: Employment Change, CPI data, and GDP figures are paramount. Weak data will increase pressure on the BoC to consider rate cuts, weakening the CAD and supporting a USD/CAD rally.
Actionable Trading Strategies Around the USD/CAD 1.4000 Level
With a clear understanding of the technical and fundamental landscape, we can now formulate actionable strategies. Sound risk management is non-negotiable in either scenario.
Strategy 1: Trading a Bullish Bounce from the Support Zone
This strategy is for those who believe the 1.4000 support will hold.
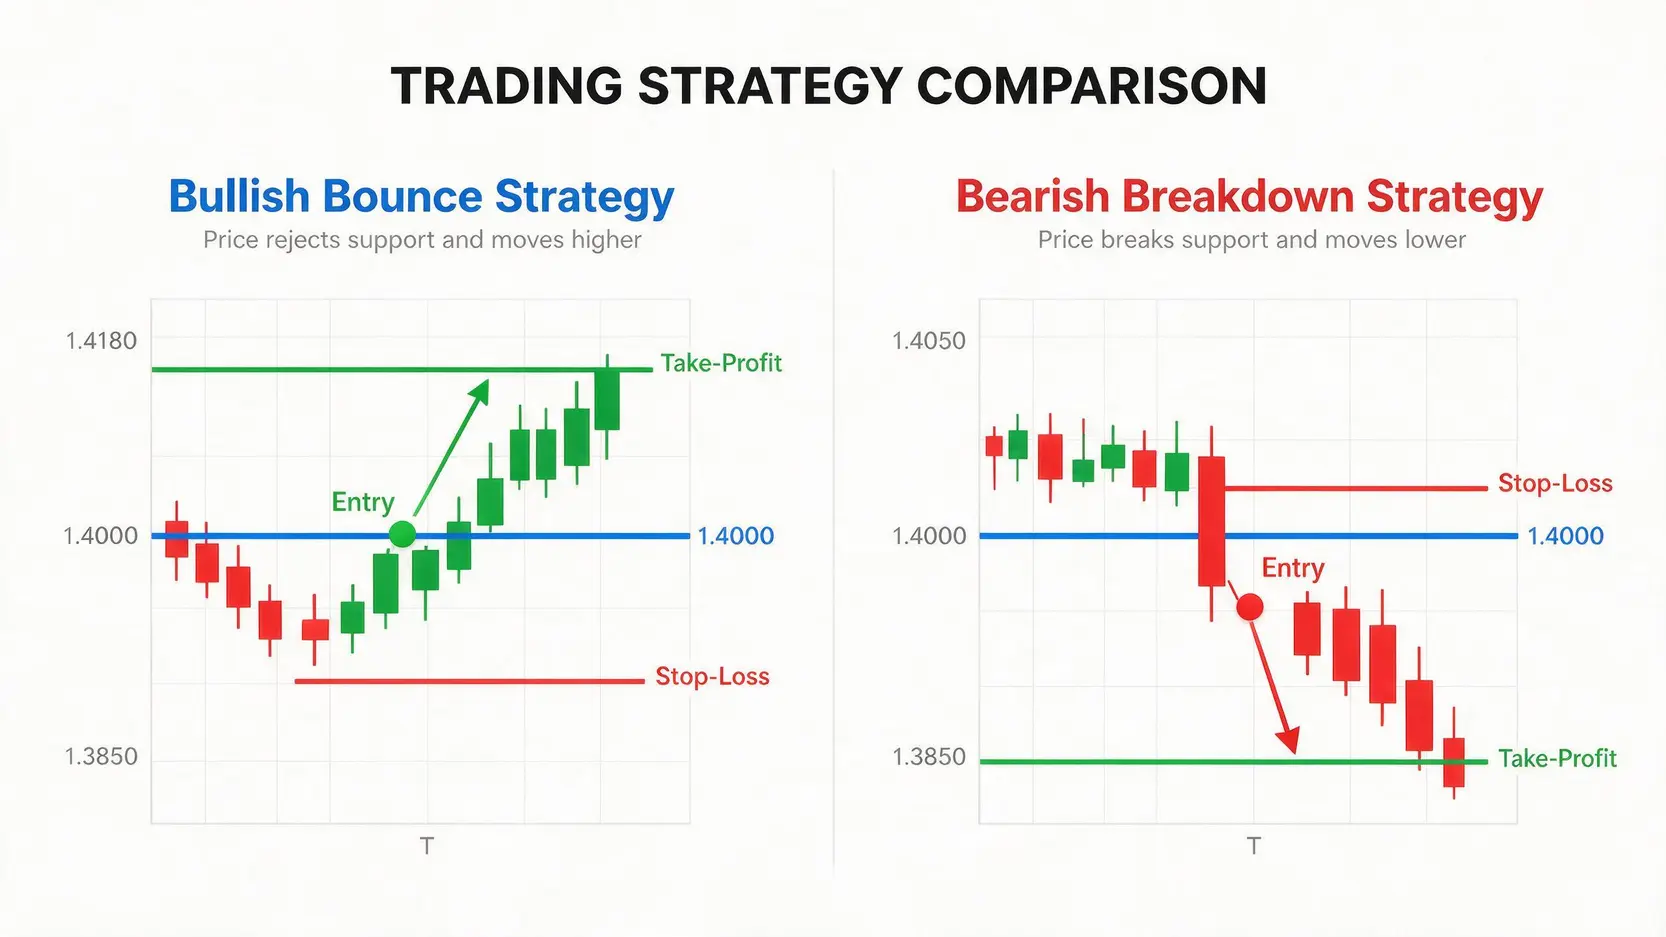
- Entry Trigger: Wait for a clear bullish confirmation on the daily chart, such as a Bullish Engulfing pattern or a strong close back above 1.4050. Do not simply buy at 1.4000 blindly.
- Stop-Loss: Place a stop-loss order below the recent swing low, perhaps around 1.3950, to protect against a false breakout.
- Take-Profit: Initial targets can be set near the 1.4180 resistance level, with a secondary target at the psychological 1.4300 mark for a higher risk-reward ratio.
Strategy 2: Playing a Bearish Breakdown Below 1.4000
This strategy is for traders anticipating a failure of the support level.
- Entry Trigger: Enter a short position only after a confirmed daily close below 1.3980. An alternative entry could be on a retest of 1.4000 as new resistance, which often provides a better risk-reward entry point.
- Stop-Loss: Set a stop-loss just above the 1.4000 level, for instance, at 1.4060, to manage the risk if the breakdown turns out to be a fakeout.
- Take-Profit: The primary target would be the 200-day SMA around 1.3850. More ambitious bears might target the major support zone at 1.3700.
Risk Management: Setting Stop-Loss and Take-Profit Levels
Regardless of the chosen strategy, disciplined risk management is paramount. Always calculate your position size based on a predefined risk percentage (e.g., 1-2% of your trading capital). Use a risk-reward ratio of at least 1:2, meaning your potential profit should be at least twice your potential loss. This ensures that even with a modest win rate, your strategy can remain profitable over the long term. For more insights, consider exploring some advanced trading strategies that incorporate dynamic risk management.
Conclusion
In conclusion, the USD/CAD 1.4000 support level remains the most critical battleground for bulls and bears in mid-2026. While technical indicators like the RSI suggest a potential for a bullish defense as momentum becomes oversold, the fundamental backdrop appears to favor the bears. The diverging monetary policies between a hawkish Fed and a dovish BoC, combined with softness in oil prices, create a powerful narrative for a potential break of this long-standing support. A confirmed hold or break of this level, validated by a decisive daily close, will likely dictate the pair’s direction for the coming weeks and months. Vigilance and disciplined risk management are essential for navigating what comes next.
Frequently Asked Questions (FAQ)
Q: Is USD/CAD currently bullish or bearish?
A: As of July 2026, the pair is at a neutral-to-bearish inflection point. It is testing a critical long-term support level at 1.4000. While the short-term momentum is bearish, a failure to break this support could quickly lead to a bullish reversal. The definitive trend will be established by whether price confirms a breakdown below or a bounce from this level.
Q: How do oil prices affect the USD/CAD pair?
A: Oil is one of Canada’s primary exports. Therefore, higher oil prices are generally positive for the Canadian economy, which tends to strengthen the Canadian Dollar (CAD). A stronger CAD means the USD/CAD exchange rate falls. Conversely, lower oil prices weaken the CAD, causing the USD/CAD pair to rise. This creates a strong inverse correlation.
Q: What is the next major support level if 1.4000 breaks?
A: If the 1.4000 support is decisively broken, the next significant technical support level to watch is the 200-day Simple Moving Average, currently located around the 1.3850 area. Below that, the 1.3700 level represents a more substantial historical support zone.
Q: What role does the Bank of Canada (BoC) play?
A: The BoC’s role is critical. Its monetary policy decisions, particularly on interest rates, directly influence the value of the Canadian Dollar. A hawkish stance (raising rates) strengthens the CAD, while a dovish stance (cutting rates or signaling future cuts) weakens it. The divergence between BoC and Fed policy is a primary driver of the USD/CAD trend.