For investors navigating the 2026 market, identifying powerful chart patterns is paramount to gaining a competitive edge. The bull flag pattern, a potent signal of a strong continuation in an uptrend, is one such formation that every serious trader should master. However, how do you effectively find and trade these bullish flag stocks 2026 to capitalize on their potential? This definitive guide will deconstruct everything required, from the anatomy of a bull flag pattern to a strategic playbook for identifying breakout stocks in 2026.
Table of Contents
What is a Bull Flag Pattern?
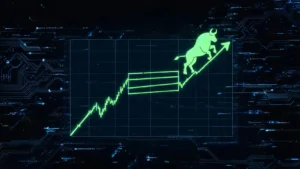
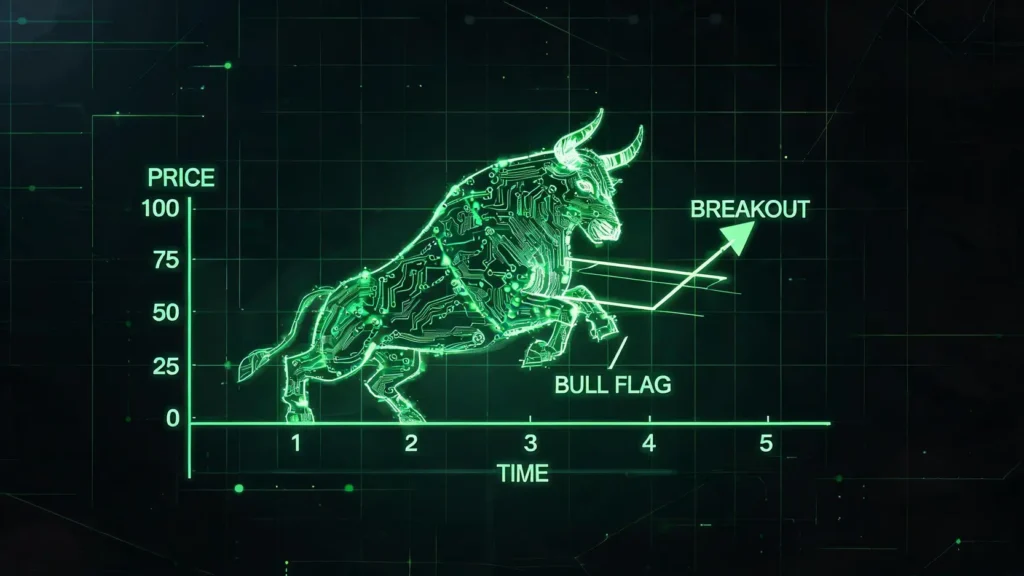
A bull flag is a technical chart pattern that signals the continuation of a strong prior uptrend. It is named for its resemblance to a flag on a pole. The pattern appears after a stock experiences a significant and sharp price increase, followed by a brief period of consolidation. This consolidation phase, or the ‘flag’, is crucial as it represents a temporary pause in the trend, allowing the market to digest the recent gains before potentially resuming its upward trajectory. The reliability of this pattern makes it a favorite among swing and day traders looking for high-probability setups.
The Anatomy of a Bull Flag: Flagpole and Consolidation
To accurately identify a bull flag, one must understand its two primary components:
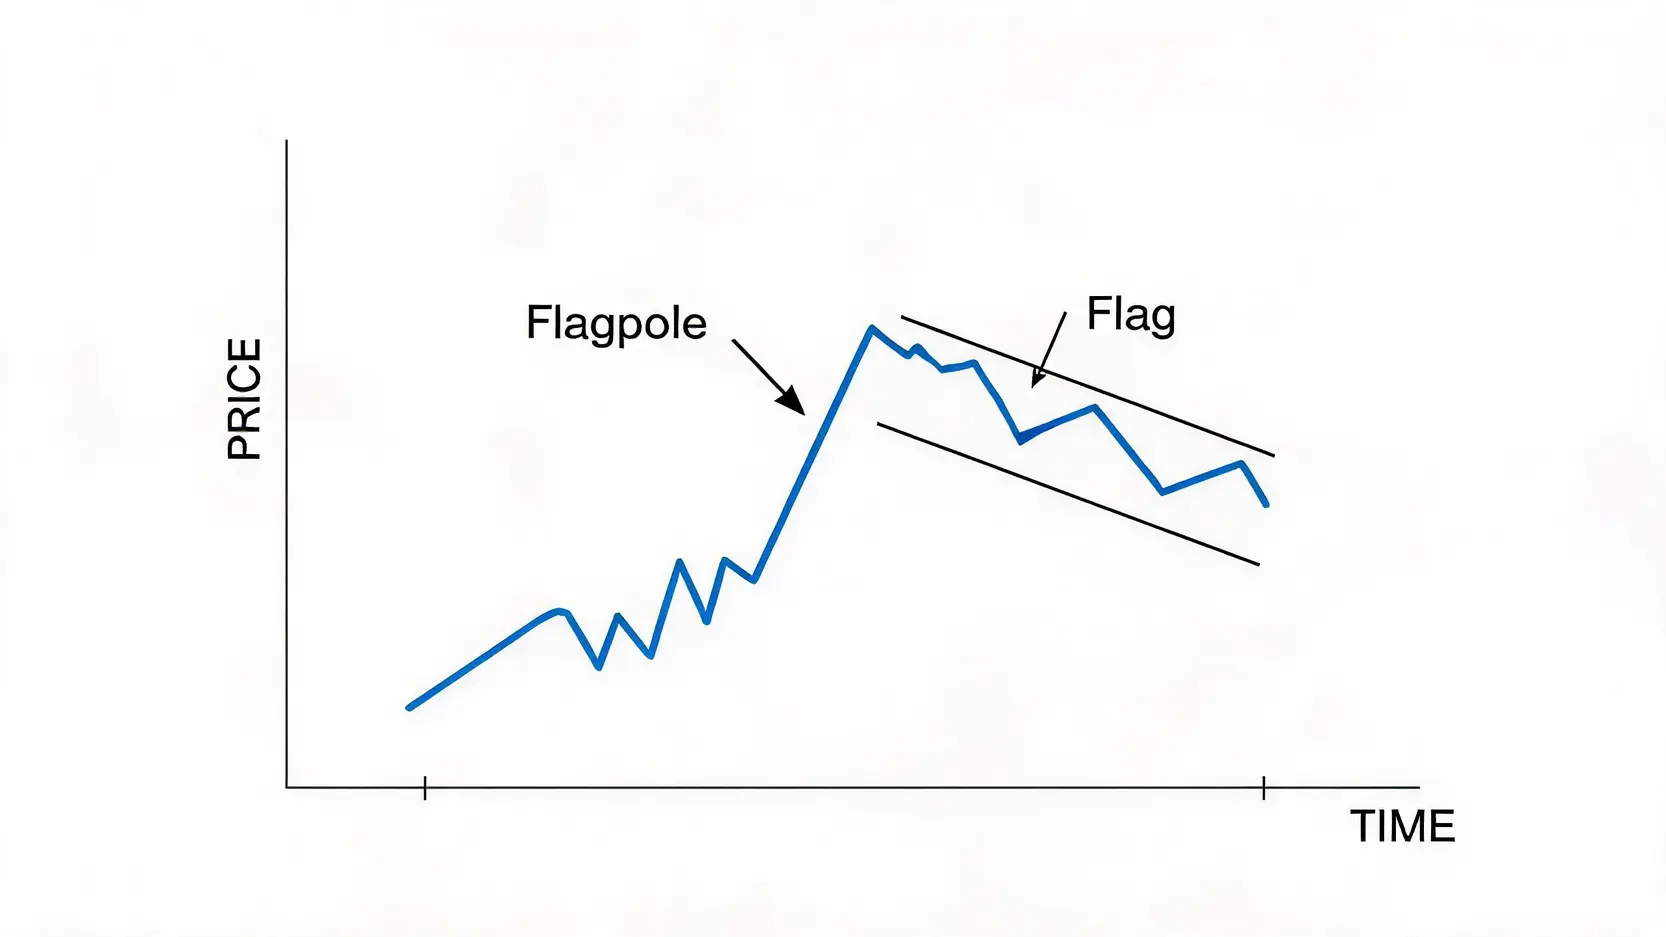
- The Flagpole: This is the initial, sharp, and almost vertical price surge. It represents an aggressive buying phase where momentum is strong. The length of the flagpole is significant as it is often used to project the potential price target after a breakout.
- The Flag (Consolidation): Following the flagpole’s formation, the price action enters a consolidation period. The flag itself is typically a rectangular or channel shape that slopes slightly downward against the prevailing uptrend. This phase should have lower highs and lower lows contained within two parallel trendlines. This orderly pullback indicates that sellers are not strong enough to reverse the trend; instead, it’s often early buyers taking profits.
What This Pattern Indicates for a Stock’s Momentum
The bull flag pattern is a powerful indicator of bullish sentiment and sustained momentum. The initial explosive move (the flagpole) demonstrates strong buying pressure. The subsequent consolidation phase (the flag) is constructive; it’s a period where the stock ‘catches its breath’ without giving back too many of its gains. This behavior suggests that the underlying conviction among buyers remains high, and they are preparing for the next leg up. When the price breaks out of the flag’s resistance, it signals that the consolidation is over and the original uptrend is resuming, often with renewed vigor.
The Critical Role of Volume in Confirming the Pattern
Volume is a critical secondary indicator that adds significant validity to a bull flag pattern. A classic bull flag exhibits a specific volume signature:
- High Volume on the Flagpole: The sharp price increase that forms the flagpole should be accompanied by a surge in trading volume. This confirms that the move is backed by strong institutional or retail buying interest.
- Decreasing Volume in the Flag: During the consolidation phase, volume should noticeably decline. This indicates that the selling pressure is light and the market is simply pausing, not reversing.
- Surging Volume on the Breakout: The most crucial volume signal occurs when the price breaks above the upper trendline of the flag. This breakout should happen on a significant spike in volume, confirming that buyers have returned in force and are ready to drive the price higher. A breakout on low volume is a red flag and may indicate a higher probability of failure. For more detailed definitions, authoritative sources like Investopedia’s explanation of flag patterns can provide additional context.
How to Trade Bull Flags: A Step-by-Step Strategy for Breakout Stocks
Trading the bull flag pattern requires a disciplined, systematic approach. Simply identifying the pattern is not enough; a successful strategy involves precise entry triggers, robust risk management, and realistic profit targets. This ensures you are not just chasing momentum but are engaging with a high-probability setup in a controlled manner.
Identifying Valid Entry Points on the Breakout
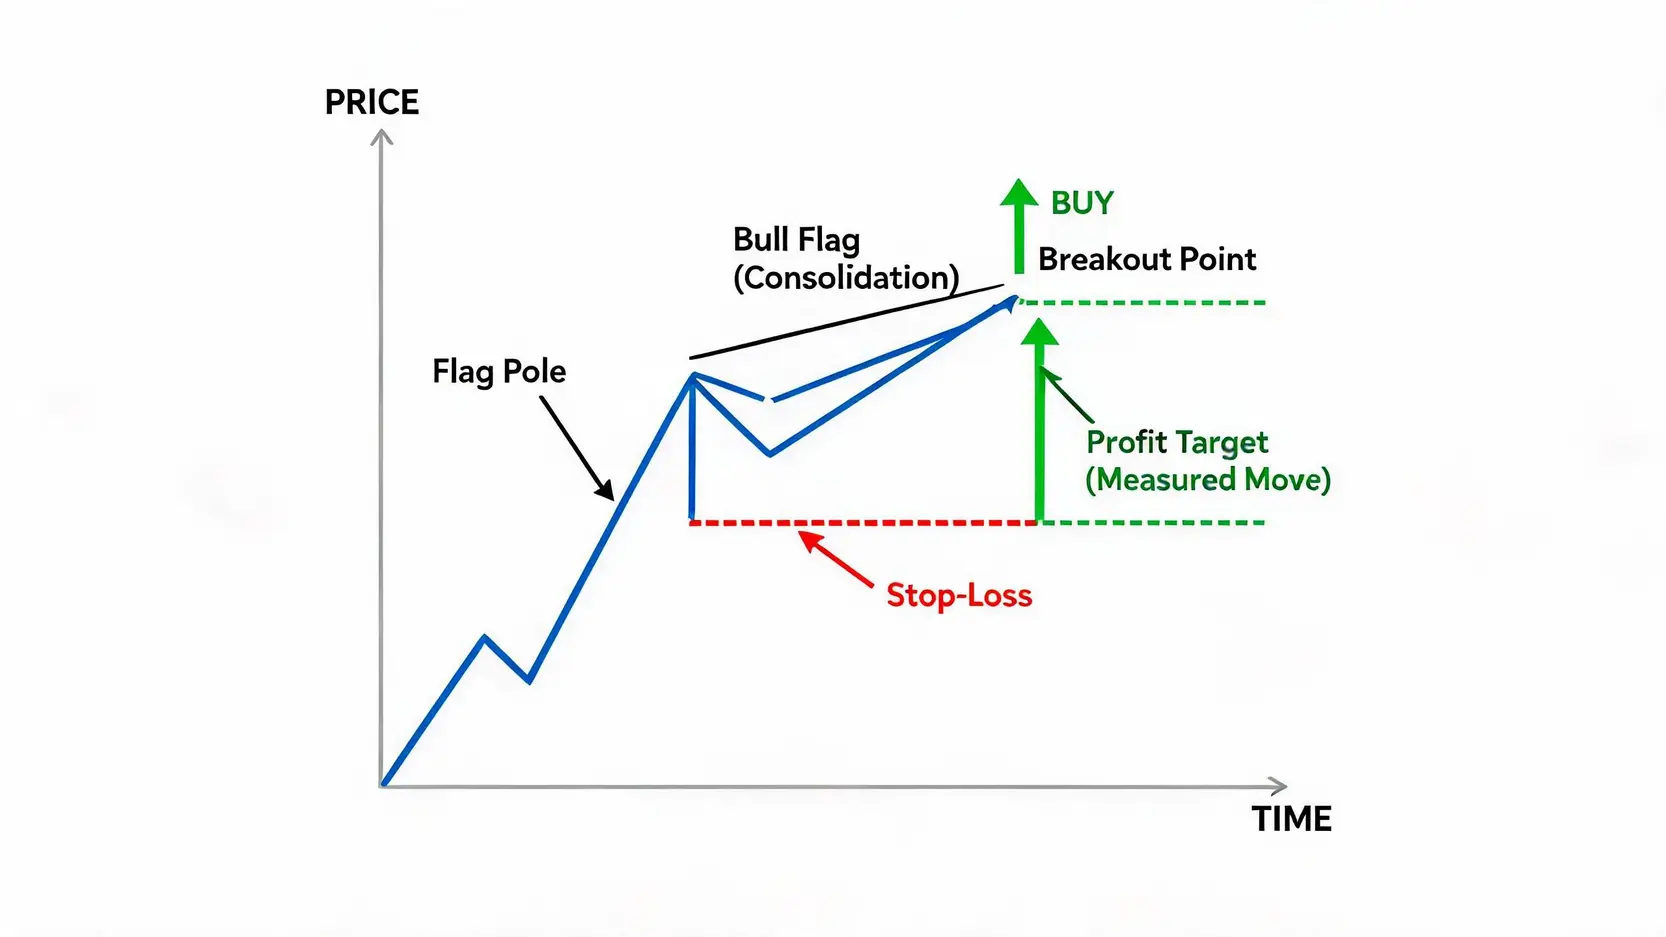
The primary entry point for a bull flag trade is on the breakout. After the flag consolidation is clearly defined by its parallel trendlines, the trigger for a long position occurs when the price closes decisively above the upper trendline (the resistance level) of the flag. Here are some key considerations for a valid entry:
- Confirmation: Do not enter the moment the price pierces the trendline. Wait for a candle (e.g., a 1-hour or 4-hour candle, depending on your timeframe) to close firmly above it. This helps to avoid ‘false breakouts’ where the price briefly spikes up only to retreat back into the consolidation channel.
- Volume Confirmation: As mentioned, the breakout should be accompanied by a significant increase in volume. This confirms the buyers’ commitment and increases the probability of a successful follow-through. An entry on a low-volume breakout is a much riskier proposition.
- Alternative Entry: A more conservative approach is to wait for a retest of the broken trendline. Sometimes, after the initial breakout, the price will pull back to touch the old resistance line, which now acts as support, before moving higher. Entering on this retest can offer a better risk/reward ratio.
Setting Strategic Stop-Loss and Profit Targets
Proper risk management is non-negotiable. Without it, even a winning pattern can lead to significant losses. For a bull flag, the stop-loss and profit targets are typically derived from the pattern’s structure:
- Stop-Loss Placement: The most logical place for a stop-loss order is just below the lowest point of the flag consolidation. Placing it here means that if the price breaks down instead of up, invalidating the pattern, your loss is contained. A more aggressive stop-loss can be placed below the midpoint of the flag, but this increases the risk of being stopped out prematurely.
- Profit Target Calculation: The standard method for setting a profit target is the ‘measured move’. Measure the vertical distance of the flagpole from its base to its peak. Then, add this distance to the breakout point of the flag. For example, if the flagpole represents a $10 price move and the breakout occurs at $110, the initial profit target would be $120. It’s often wise to take partial profits at this level and move the stop-loss to break-even to secure gains.
Bull Flag vs. Bear Flag: Understanding the Key Differences
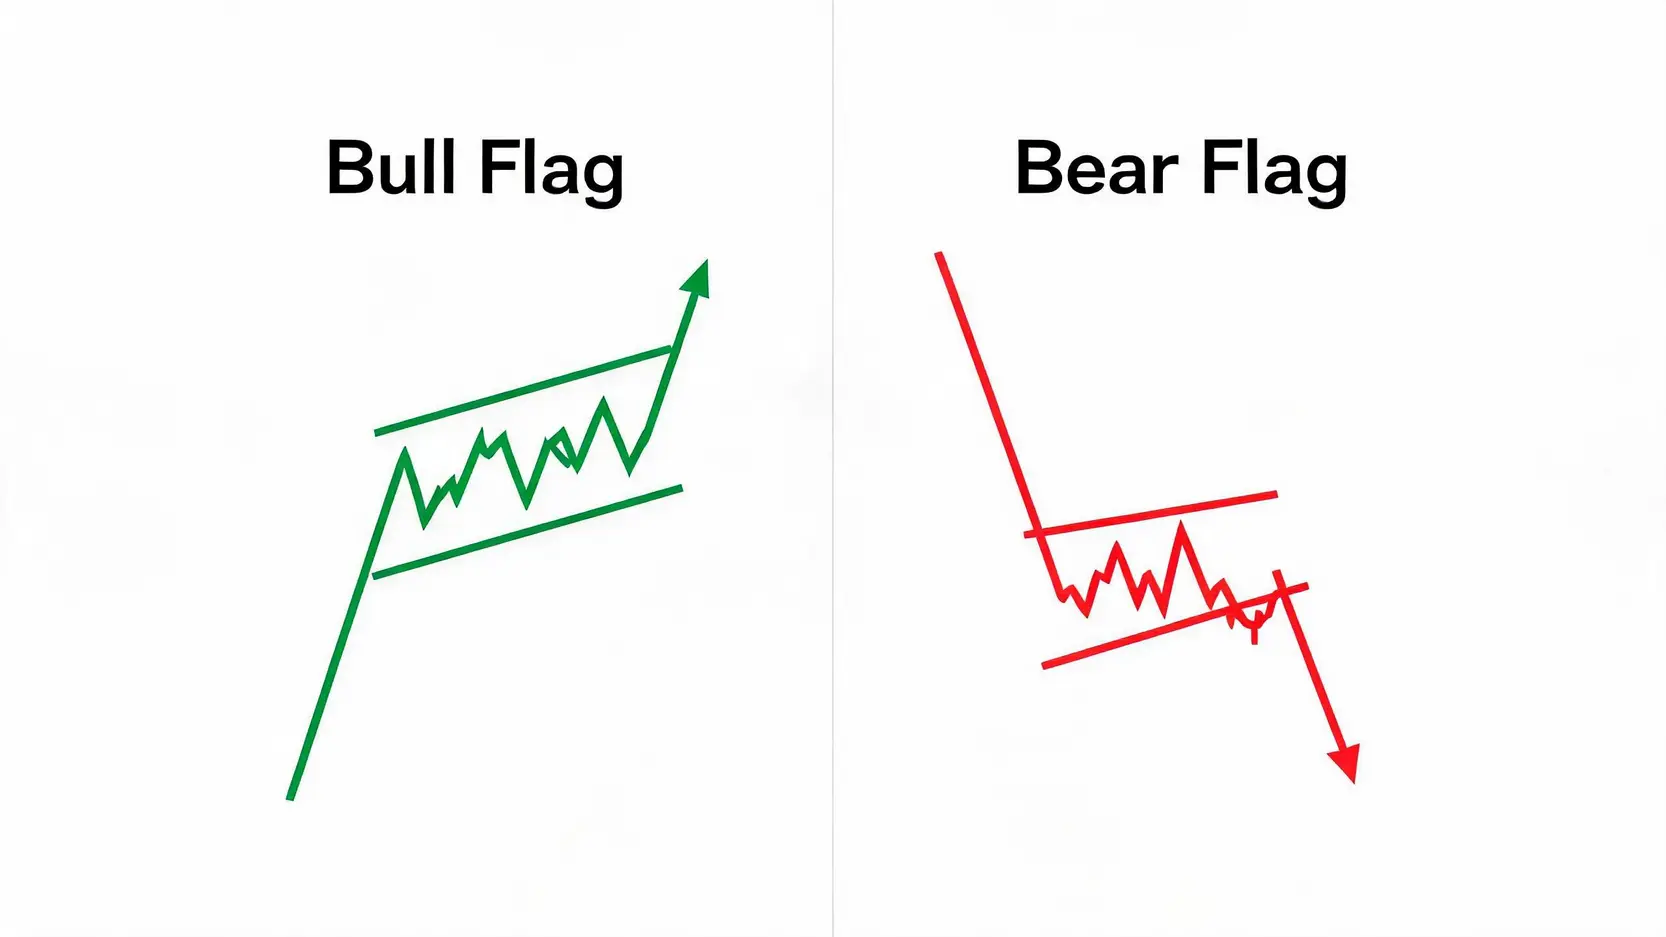
It is crucial to distinguish a bull flag from its bearish counterpart, the bear flag. While they are structurally similar, they are mirror opposites and signal different outcomes:
- Trend: A bull flag forms during a strong uptrend. A bear flag forms during a strong downtrend.
- Flagpole Direction: In a bull flag, the flagpole is a sharp move up. In a bear flag, the flagpole is a sharp move down.
- Consolidation Direction: The flag in a bull flag pattern typically drifts slightly downward. The flag in a bear flag pattern typically drifts slightly upward (a ‘bear market rally’).
- Signal: A bull flag signals a likely continuation of the uptrend. A bear flag signals a likely continuation of the downtrend. Confusing the two can lead to disastrous trading decisions.
How to Find Potential Bull Flag Stocks for 2026
In the dynamic market of 2026, proactively finding stocks that are forming bull flag patterns can give you a significant advantage. This requires leveraging the right tools and focusing on sectors with strong underlying momentum. It’s about combining technical scanning with a top-down market analysis.
Using Stock Screeners to Find Bull Flags (e.g., Finviz, TradingView)
Stock screeners are indispensable tools for identifying potential bull flag candidates from thousands of listed stocks. Platforms like Finviz, TradingView, or Thinkorswim offer powerful scanning capabilities. Here is a sample screening formula you could use to get started:
- Performance Filters: Set a filter for strong short-term performance to identify the flagpole. For instance, look for stocks that are up >20% in the last month.
- Price vs. Moving Average: Filter for stocks trading above key moving averages, like the 20-day and 50-day moving averages, to ensure they are in a confirmed uptrend.
- Consolidation Filters: Look for stocks that are currently trading a certain percentage below their recent highs (e.g., Price 5-10% below 52-Week High). This helps find stocks in a pullback/consolidation phase.
- Volume Filters: Set a minimum average daily volume (e.g., >500,000 shares) to ensure adequate liquidity.
After running the screener, you must manually review the charts of the resulting stocks to visually confirm the presence of a clean flagpole and a well-defined, low-volume consolidation channel. The screener finds potential candidates; your analysis validates the pattern.
Key Sectors to Watch for Bullish Setups in 2026
As of mid-2026, several sectors are exhibiting the kind of strong, sustained momentum that is fertile ground for bull flag patterns. Concentrating your scanning efforts on these areas can increase your hit rate:
- 🤖 Artificial Intelligence (AI): The AI revolution continues to be a dominant theme. Companies involved in AI hardware (semiconductors), software, and applications are showing persistent strength. Their charts are often characterized by strong impulse moves followed by brief consolidations.
- 🔋 Renewable Energy & Battery Technology: With the ongoing global energy transition, stocks in solar, wind, and especially battery storage and EV infrastructure are experiencing powerful secular growth trends.
- 🧬 Biotechnology and Genomics: Breakthroughs in gene editing and personalized medicine are driving significant capital flows into the biotech sector, leading to volatile but strong uptrends perfect for continuation patterns. Exploring AI-related investment opportunities can often overlap with these high-growth sectors.
Common Pitfalls: When is a Bull Flag Pattern Invalidated?
Not every pattern that looks like a bull flag will play out as expected. Recognizing the signs of invalidation is a key part of risk management:
- Breakdown of Support: The clearest sign of invalidation is when the price breaks down and closes below the lower trendline of the flag. This indicates that sellers have overwhelmed buyers, and the uptrend is likely over.
- Excessively Long Consolidation: A valid flag should be a relatively brief pause. If the consolidation phase drags on for too long (e.g., longer than the time it took the flagpole to form), it suggests that buying momentum is waning and the pattern is losing its predictive power.
- Volume Anomaly: If volume increases significantly during the consolidation phase instead of decreasing, it can be a warning sign. This suggests that there is meaningful distribution (selling) occurring, which could undermine the subsequent breakout attempt.
Conclusion
Mastering the bull flag pattern is an invaluable skill for any trader aiming for success in the 2026 market and beyond. By understanding its precise structure, applying a disciplined step-by-step trading strategy, and knowing where to hunt for potential bullish flag stocks, you can significantly improve your ability to capitalize on established market trends. Always remember that technical patterns are about probabilities, not certainties. Combining this knowledge with diligent research, macroeconomic awareness, and unwavering risk management will always be the ultimate key to sustained performance.
Frequently Asked Questions (FAQ)
Q: How reliable is the bull flag pattern?
A: The bull flag is considered one of the more reliable continuation patterns in technical analysis, especially when all conditions are met (strong flagpole, low-volume consolidation, and a high-volume breakout). However, no pattern is 100% foolproof. Its reliability increases when combined with other confirming indicators and sound risk management principles. Always be prepared for the possibility of a pattern failure.
Q: What is the difference between a bull flag and a bullish pennant?
A: Both are bullish continuation patterns, but their consolidation phases differ in shape. A bull flag has a rectangular or channel-shaped consolidation with parallel trendlines. A bullish pennant has a triangular consolidation, with converging trendlines. The trading psychology is very similar, but the visual representation is the key difference.
Q: Can the bull flag pattern be used in crypto and forex trading?
A: Yes, absolutely. The bull flag pattern is a universal principle of market psychology and momentum. It can be effectively applied to any liquid market, including cryptocurrencies, forex pairs, commodities, and indices. The principles of flagpole, consolidation, volume, and breakout remain the same across all asset classes.
Q: What timeframes are best for trading bull flags?
A: The pattern is fractal, meaning it appears on all timeframes. Day traders might look for bull flags on 1-minute and 5-minute charts, while swing traders would focus on hourly, 4-hour, and daily charts. Long-term investors might even identify them on weekly charts. The best timeframe depends entirely on your personal trading style and strategy.