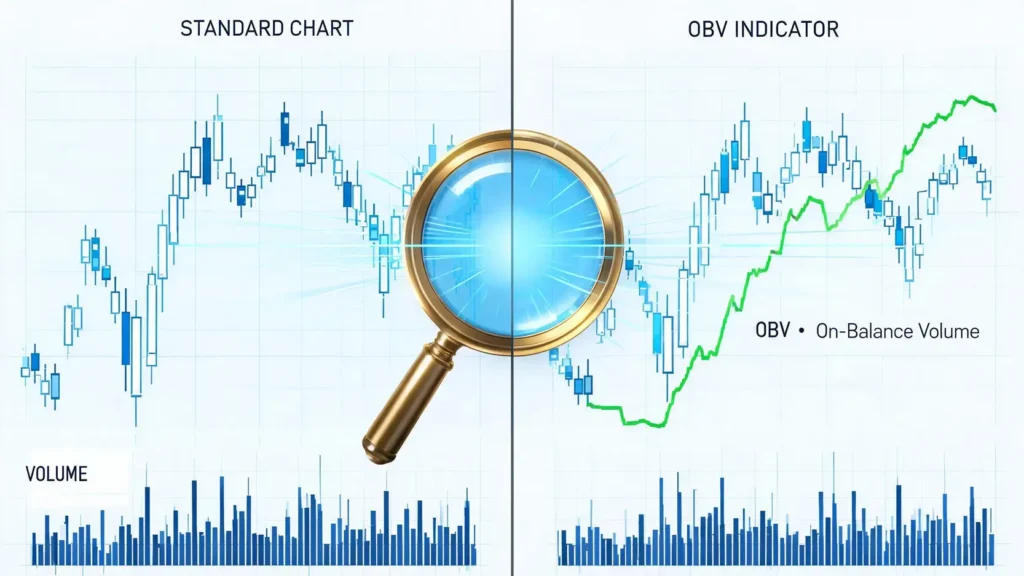
The long-standing debate over the OBV indicator vs volume: which is better for market analysis, is not about finding a single definitive tool but about understanding their distinct roles.
While both metrics are derived from trading activity, they offer profoundly different perspectives on market dynamics. Standard volume provides a raw, unfiltered snapshot of market participation over a specific period, whereas the On-Balance Volume (OBV) indicator refines this data into a cumulative line, tracking the flow of buying and selling pressure over time. This distinction is crucial; volume reveals the intensity of activity, while OBV attempts to reveal the direction of the ‘smart money’.
This comprehensive guide will dissect the nuances of the OBV indicator vs volume comparison. We will explore their underlying mechanics, identify the key differences that every trader must understand, and outline specific scenarios where one may provide a clearer signal than the other.
Ultimately, the goal is not to declare one superior but to equip traders with the knowledge to synthesise insights from both, leading to more robust and well-informed trading decisions.
Table of Contents
What is On-Balance Volume (OBV) and How Does It Work?
The On-Balance Volume (OBV) is a cumulative momentum indicator that uses volume flow to predict changes in the asset’s price. Developed by Joseph Granville in the 1960s, its core premise is that volume precedes price. A significant shift in volume, as tracked by the OBV, can signal an impending major price movement.
The indicator provides a running total of an asset’s trading volume, showing whether this volume is flowing into or out of a security. A rising OBV line suggests positive volume pressure that can lead to higher prices, while a falling OBV indicates negative pressure that may precede price declines. Dissecting the OBV indicator vs volume relationship starts with understanding this cumulative nature.
The Core Formula of the OBV Indicator
The calculation for OBV is straightforward and operates on a period-by-period basis:
- If today’s closing price is higher than yesterday’s close: Current OBV = Previous OBV + Today’s Volume
- If today’s closing price is lower than yesterday’s close: Current OBV = Previous OBV – Today’s Volume
- If today’s closing price equals yesterday’s close: Current OBV = Previous OBV (no change)
This simple logic creates a running total. The actual numerical value of the OBV is not important; rather, traders focus on its direction and its relationship with the price chart.
Interpreting the OBV Line: Cumulative Pressure
The primary use of the OBV is to confirm price trends and to spot divergences. When both price and the OBV are making higher peaks and higher troughs, the upward trend is considered healthy and likely to continue. Conversely, if price and OBV are making lower peaks and lower troughs, the downtrend is confirmed.
The key value of OBV emerges when its path diverges from the price, a concept we will explore in detail later. It’s this ability to show underlying pressure that marks a critical difference in the OBV indicator vs volume analysis.
What is Standard Trading Volume?
Standard trading volume is the most fundamental measure of market activity, representing the total number of shares, contracts, or units of an asset traded during a specified time frame (e.g., one minute, one hour, one day). It is typically displayed as a bar chart at the bottom of a price chart, with each bar corresponding to the price candle directly above it. Unlike OBV, it is not cumulative; each bar is a discrete measure of activity for its own period. This raw, immediate data is essential for understanding market interest and conviction.
How to Read a Volume Bar on a Chart
Interpreting volume bars is relatively straightforward:
- Bar Height: The higher the bar, the greater the volume traded during that period. Exceptionally high bars, known as volume spikes, indicate a significant surge in interest.
- Bar Colour: Often, the volume bar is coloured to match its corresponding price candle. A green bar indicates the closing price was higher than the opening price, while a red bar indicates the opposite. This helps to quickly associate buying or selling pressure with the volume.
- Average Volume: Many charting platforms include a moving average line overlaid on the volume bars. This helps traders instantly see if the current volume is above or below the recent average, providing context to its significance.
The Role of Volume in Market Analysis
Volume is paramount for confirming the strength and validity of price movements. A price rally on high and increasing volume is seen as strong and sustainable. Conversely, a price rally on low and declining volume is viewed with suspicion, suggesting a lack of conviction that could lead to a reversal. This role as a confirmation tool is a cornerstone of technical analysis and a vital point of comparison when evaluating OBV indicator vs volume: which is better for a specific trading objective.
OBV vs Volume: The 4 Key Differences You Must Know
Understanding the fundamental distinctions between these two tools is critical for their effective application. While both originate from the same raw data, their calculation and interpretation differ significantly. Here we break down the core of the OBV indicator vs volume debate into four key differences.
| Feature | On-Balance Volume (OBV) | Standard Volume |
| Data Type | Cumulative line graph | Period-specific bar chart |
| Primary Function | Measures cumulative buying/selling pressure | Measures total activity in a single period |
| Indicator Type | Often acts as a leading indicator (divergence) | Primarily a confirming indicator |
| Best Use Case | Trend confirmation and identifying divergence | Breakout confirmation and liquidity analysis |
Difference 1: Cumulative vs. Period-Specific Data
This is the most significant difference. Volume bars show the trading activity for one single period. A huge volume spike on a daily chart tells you something important happened on that day, but it is isolated from the day before and the day after.
In contrast, OBV is a running total. Every period’s volume is added to or subtracted from the previous total, creating a continuous line that reflects the history of volume flow. This makes OBV better for analysing the persistent, underlying pressure over weeks or months, while standard volume is superior for analysing the impact of specific events or news.
Difference 2: Leading vs. Confirming Indicator
Standard volume is overwhelmingly a confirming indicator. A breakout happens, and traders look to the volume bar to confirm if there is sufficient participation to validate the move. The price moves first, and volume confirms. The OBV, particularly through the mechanism of divergence, can act as a leading indicator.
For example, if the price is making new highs but the OBV line fails to do so, it suggests that the underlying volume pressure is weakening. This divergence can warn traders of a potential trend reversal before the price action explicitly signals it.
Difference 3: Trend & Divergence vs. Breakout Confirmation
These distinct characteristics lead to different primary use cases. The OBV’s strength lies in analysing the health of an existing trend and spotting divergence. Is the ‘smart money’ still accumulating during an uptrend, or is it distributing into the rally? OBV helps answer this. Standard volume excels at event-driven analysis.
When a stock breaks out of a consolidation pattern, a massive spike in volume provides strong evidence that the move is genuine and has institutional backing. It is less effective at showing the subtle, cumulative changes that OBV is designed to detect.
Difference 4: Simplicity vs. Nuance in Interpretation
A high volume bar is simple to interpret: there was a lot of activity. The context of the price bar gives it meaning, but the data itself is straightforward. The OBV line requires more nuanced interpretation. A rising OBV is bullish, and a falling one is bearish, but its real power comes from comparing its trend and momentum to that of the price.
This requires analysing slopes, peaks, troughs, and divergences, making it a more complex tool that demands more experience to use effectively. This complexity is a key factor in the ongoing OBV indicator vs volume discussion.
When Regular Volume is the Superior Choice
While OBV offers a sophisticated view of volume flow, there are several critical trading scenarios where raw, standard volume is not just better but essential.
For Confirming Price Breakouts and Breakdowns
This is the classic and most powerful use of standard volume. When an asset’s price breaks above a key resistance level or below a critical support level, traders immediately look to volume for confirmation. A breakout accompanied by a surge in volume (ideally several times the average) demonstrates strong conviction and increases the probability that the move will be sustained.
A breakout on low volume is a red flag, suggesting a lack of participation that could result in a ‘false breakout’ or reversal. In this context, OBV is too slow and cumulative to provide the instant validation required.
For Assessing Market Liquidity and Volatility
Before entering any trade, assessing an asset’s liquidity is crucial. Standard volume provides a direct measure of this. Assets with consistently high daily volume are liquid, meaning traders can enter and exit positions easily without significantly impacting the price. Low-volume assets can be illiquid, leading to wider bid-ask spreads and slippage.
Furthermore, sudden spikes in volume can signal the start of a high-volatility period, which is vital information for risk management. OBV does not provide this clear, immediate picture of an asset’s tradability.
When the OBV Indicator Provides a Clearer Signal
The OBV indicator excels in situations where the aggregate flow of volume over time provides more insight than a single period’s activity. Its strength is in revealing subtle shifts in market sentiment that may not be immediately apparent from price action alone.
To Identify Bullish and Bearish Divergence
Divergence is arguably the most powerful signal generated by the OBV. It occurs when the indicator’s movement contradicts the price movement.
- Bearish Divergence: The price pushes to a new high, but the OBV fails to reach a new high. This suggests that the latest price rally lacks the support of strong volume, indicating that buying pressure is waning and a reversal could be imminent.
- Bullish Divergence: The price falls to a new low, but the OBV makes a higher low. This indicates that despite the new price low, selling pressure is decreasing, and accumulation may be occurring, potentially foreshadowing a price rebound.
To Confirm the Strength of an Existing Trend
During a sustained trend, OBV should move in the same direction as the price. In a healthy uptrend, both price and OBV should be making a series of higher highs and higher lows. This confirmation from OBV provides confidence that the trend is backed by genuine volume flow. If the price continues to rise but the OBV line begins to flatten or decline, it is a warning sign that the trend is losing its underlying momentum, even if the price action has not yet reflected this weakness.
How to Combine OBV and Volume for a Winning Strategy
The most effective approach is not to choose a side in the OBV indicator vs volume debate, but to synthesise the signals from both into a cohesive analytical process. By using them as complementary tools, traders can build a more comprehensive view of market dynamics. Here is a practical framework:
- Step 1: Identify the Broader Trend with OBV. Start by analysing the OBV on a higher time frame (e.g., daily chart) to gauge the long-term cumulative flow. Is the OBV in a clear uptrend, downtrend, or moving sideways? This establishes your primary market bias. An uptrending OBV suggests you should favour looking for buying opportunities.
- Step 2: Look for Price Setups. With your market bias established, turn your attention to the price chart. Identify key support and resistance levels, chart patterns (e.g., flags, triangles, head and shoulders), or potential breakout zones that align with the OBV’s direction.
- Step 3: Use Standard Volume for Entry Confirmation. When the price approaches your identified setup (e.g., a breakout above resistance), watch the standard volume bars closely. A decisive move through the level must be accompanied by a significant spike in volume. This is your trigger. The OBV gave you the strategic direction, but the standard volume gives you the tactical entry signal.
- Step 4: Manage the Trade with Both Indicators. Once in the trade, continue to monitor both. The OBV should continue to move in the direction of your trade, confirming the trend’s health. Meanwhile, look at standard volume on pullbacks. A pullback on low volume is often healthy, suggesting a temporary pause, while a pullback on high volume could signal a potential reversal.
Conclusion
Ultimately, the question of OBV indicator vs volume: which is better yields a clear answer: neither is universally superior. They are different tools designed for different tasks. Standard volume offers an indispensable, real-time gauge of market conviction, making it the premier tool for confirming breakouts and assessing liquidity.
The On-Balance Volume indicator provides a more nuanced, long-term perspective on the flow of capital, making it exceptional for confirming trend strength and, most importantly, identifying divergences that can foreshadow major reversals.
A sophisticated trader does not choose between them but rather learns to integrate their signals, using OBV for strategic context and standard volume for tactical precision. This dual-pronged approach, combined with robust price action analysis and disciplined risk management, offers a far more resilient and insightful method for navigating the financial markets.
Frequently Asked Questions (FAQ)
Is OBV a reliable indicator on its own?
No, the OBV indicator should not be used in isolation. While powerful for identifying divergence and trend strength, it can produce false signals. Its signals must always be validated by price action, support and resistance levels, and other forms of technical analysis. It is a supplementary tool, not a complete trading system.
Can the OBV indicator be used for day trading?
Yes, OBV can be applied to intraday time frames (e.g., 5-minute or 15-minute charts). However, its cumulative nature means it can be susceptible to ‘noise’ on lower time frames. Many day traders find that standard volume, in conjunction with tools like the Volume-Weighted Average Price (VWAP), provides more actionable, real-time signals for short-term trading.
What is the biggest limitation of using the OBV indicator?
The primary limitation of OBV is its simplistic calculation. It treats all volume on an up day as positive and all volume on a down day as negative, regardless of the intraday price action. A massive gap up followed by selling all day will still register as positive volume if the close is above the prior day’s close. Furthermore, a single anomalous event with extremely high volume can permanently skew the OBV line, making subsequent interpretation difficult.
Does OBV work in all markets?
OBV is most effective in markets where volume data is readily available and meaningful, such as equities and futures. Its application in decentralised markets like foreign exchange (Forex) is more challenging, as there is no central exchange to provide a definitive volume figure. While some brokers provide their own volume data, it only represents a fraction of the total market, potentially limiting the OBV’s reliability.