In the fast-paced world of the stock market, identifying high-potential tech stocks requires a sharp eye for predictive signals. For traders aiming to capitalize on upward momentum, the tech stocks bullish flag pattern stands out as a formidable tool. This classic technical indicator often signals a brief pause in a strong uptrend before the next major leg up. Understanding how to identify the bullish flag pattern in tech stocks is not just a theoretical exercise; it’s a practical skill that can unlock significant trading opportunities. This guide will walk you through its anatomy, identification process, and actionable trading strategies, providing the clarity needed to act decisively.
Table of Contents
What Is a Bullish Flag Pattern?
A bullish flag is a chart pattern that occurs during a strong uptrend. It’s classified as a continuation pattern, meaning it suggests the preceding trend is likely to resume. The pattern’s name comes from its visual resemblance to a flag on a pole. It represents a temporary consolidation or pause in the price action before the next surge. For traders in the tech sector, recognizing this formation can be a powerful indicator of sustained investor confidence and potential future gains.
To fully grasp its significance, it’s essential to break down its core components and understand the market psychology that drives it. The pattern is a visual representation of a market that is catching its breath before continuing its primary trajectory. For more detailed information, you can refer to Investopedia’s explanation of flag patterns.
The Anatomy of the Pattern: The Flagpole
The first component of a bullish flag is the flagpole. This is characterized by a sharp, almost vertical price increase on high volume. This initial surge represents a strong buying impulse, driven by positive news, strong earnings reports, or overall sector strength. The flagpole establishes the primary uptrend and is the foundational element of the pattern. Without a clear and strong flagpole, the subsequent consolidation lacks the bullish context necessary to be considered a valid flag pattern.
The Anatomy of the Pattern: The Consolidating Flag
Following the sharp rise of the flagpole, the price enters a consolidation phase, which forms the flag itself. This part of the pattern looks like a small, downward-sloping rectangle or channel. Key characteristics of the flag include:
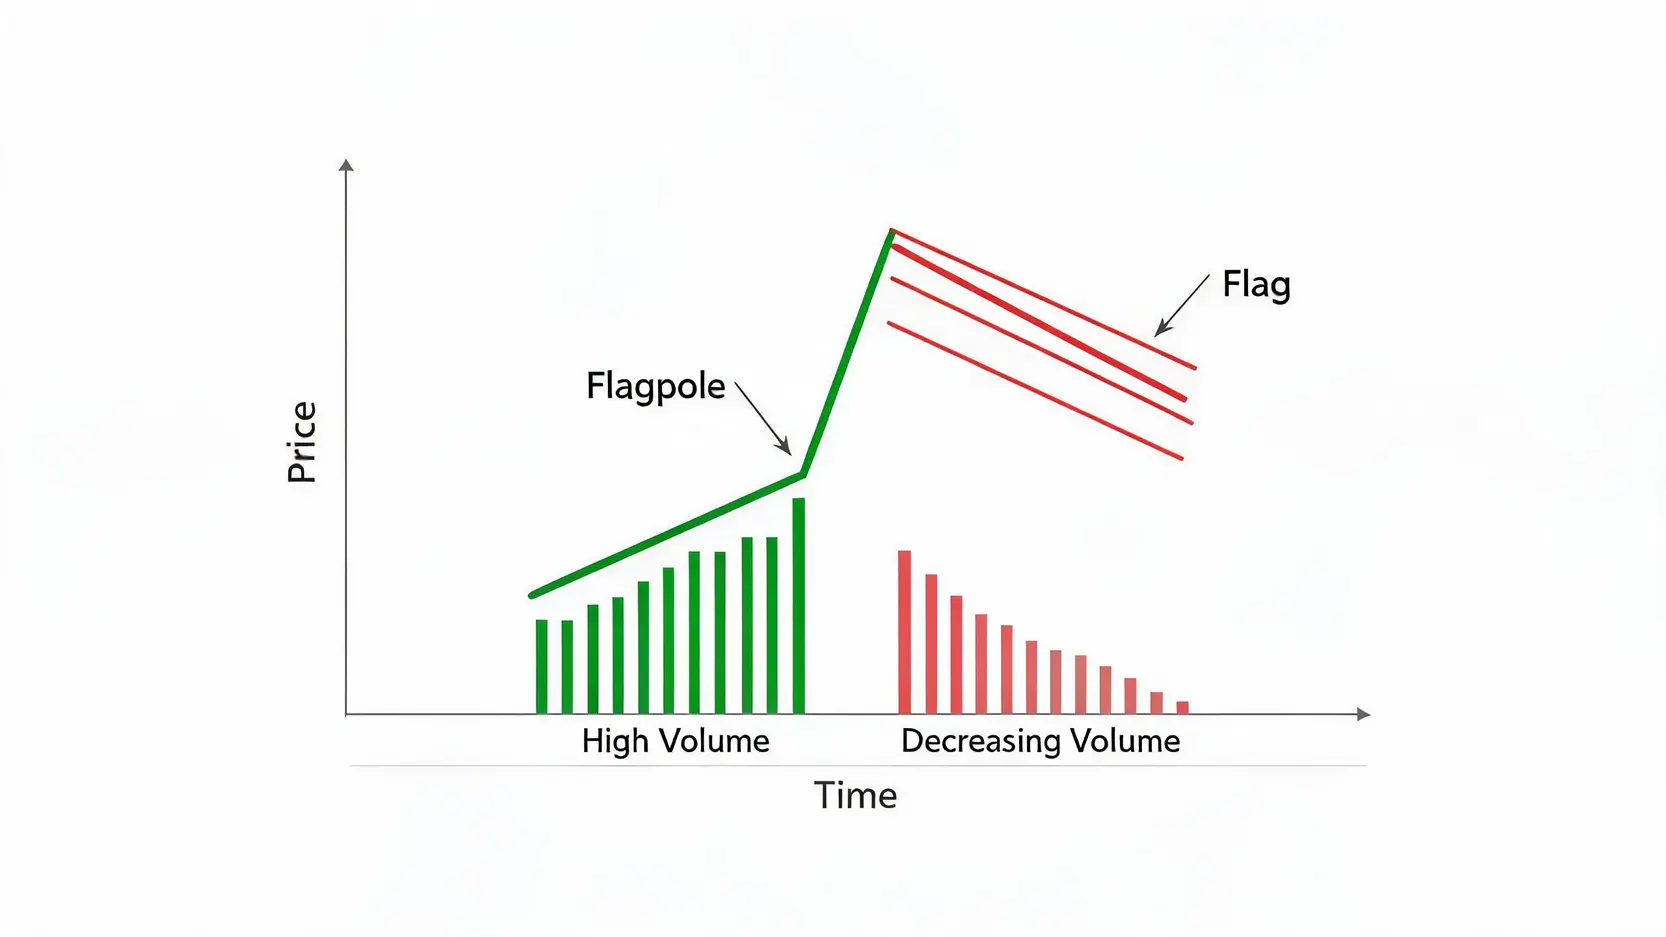
- Parallel Trend Lines: The upper and lower boundaries of the flag run parallel to each other.
- Downward Drift: The flag typically drifts down against the primary trend, representing minor profit-taking and consolidation.
- Decreasing Volume: Trading volume should ideally decline during the formation of the flag. This indicates that the selling pressure is not significant and that the majority of market participants are holding their positions in anticipation of another move higher.
Why It Signals a Potential Breakout
The psychology behind the bullish flag pattern is crucial. The initial flagpole surge attracts significant attention. The subsequent consolidation (the flag) is a period where the market digests the recent gains. The declining volume suggests that the initial buyers are not rushing to sell. Instead, new buyers are gradually absorbing the supply from early profit-takers. This period of equilibrium eventually resolves when the buyers re-emerge, pushing the price above the flag’s upper resistance level, triggering a breakout and the continuation of the original uptrend.
How to Identify a Bullish Flag Pattern in Tech Stocks: A Step-by-Step Guide
Identifying a bullish flag pattern on a stock chart requires a systematic approach. By following a clear set of steps, traders can increase their accuracy and confidence in spotting these high-probability setups, particularly in volatile tech stocks.
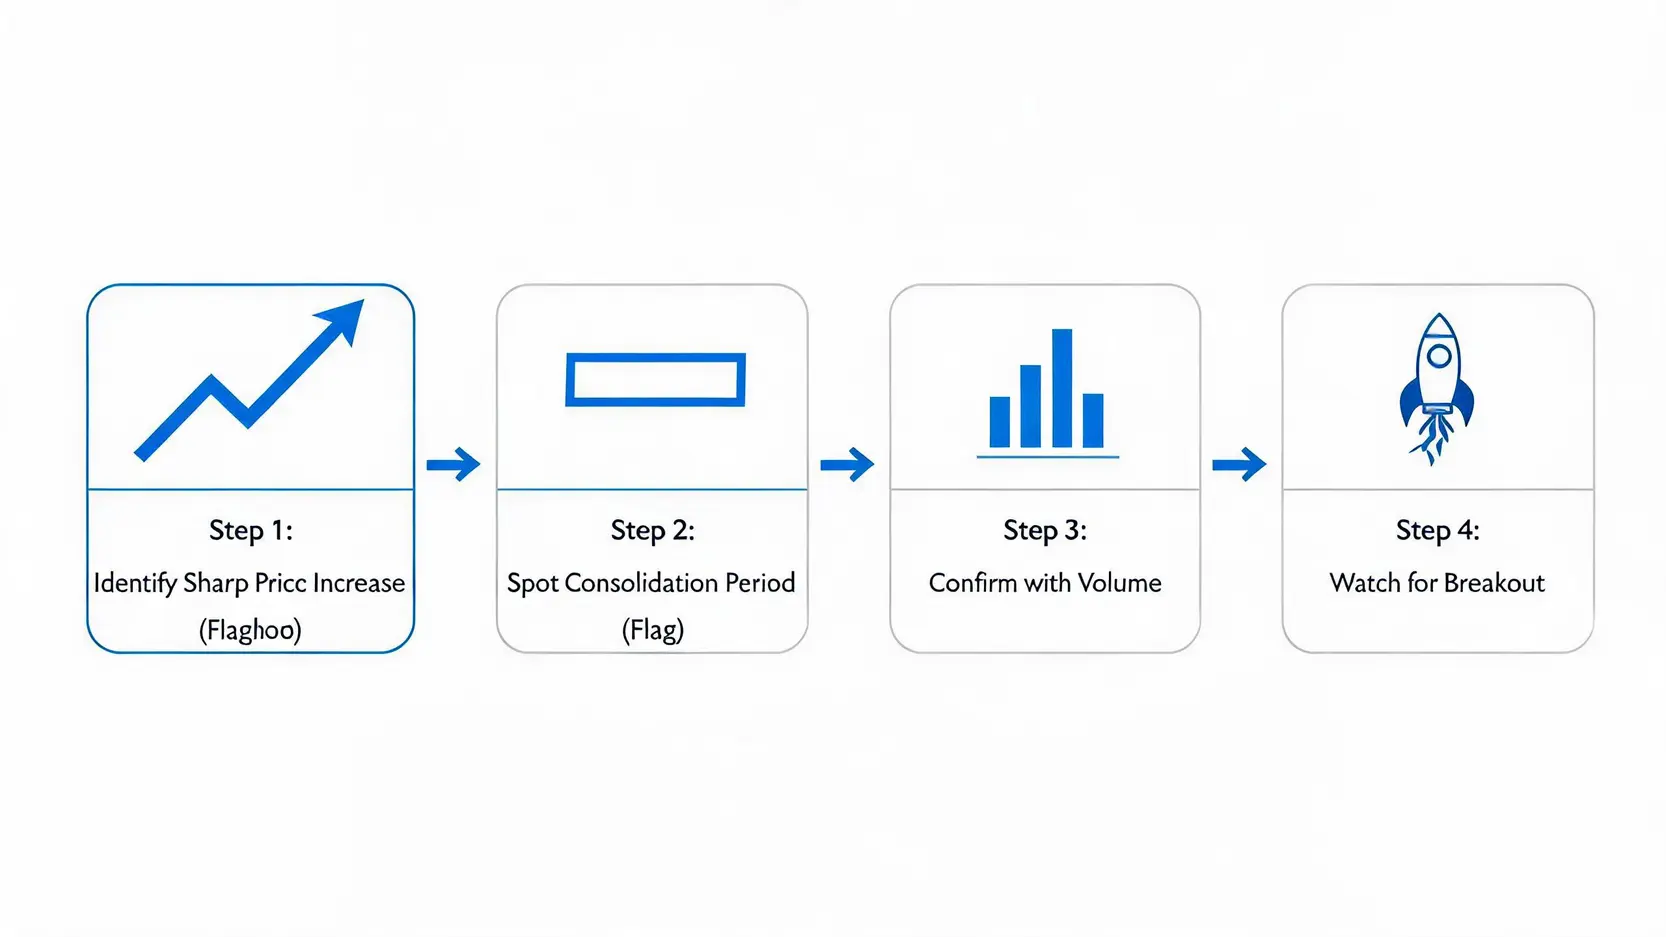
Step 1: Look for a Sharp Price Increase (The Flagpole)
The first and most critical step is to identify a strong, preceding uptrend—the flagpole. This should be a significant move upwards, often occurring over a short period. Look for a price increase of at least 20-30%, although more aggressive moves are common in the tech sector. This initial impulse is what provides the energy for the potential continuation.
Step 2: Spot the Period of Consolidation (The Flag)
After the flagpole, search for a period of orderly consolidation. The price should trade within a narrow range, forming two parallel trend lines that slope gently downwards. This flag portion should be relatively short, typically lasting from one to four weeks on a daily chart. A consolidation that is too long or too deep might negate the pattern’s predictive power.
Step 3: Confirm with Trading Volume
Volume is a powerful confirmation tool for the bullish flag pattern. 📈 During the flagpole’s formation, volume should be high, confirming the strength of the buying pressure. As the flag forms, volume should noticeably decrease. This signifies that the selling interest is drying up. A sudden surge in volume on the breakout from the flag is the final confirmation that the uptrend is likely to resume. This is a critical bull flag confirmation signal.
Step 4: Watch for the Breakout
The pattern is completed when the price breaks decisively above the upper trend line of the flag. This breakout should occur on a significant increase in volume. The breakout signals that the consolidation period is over and that the buyers have regained control, paving the way for the next leg higher.
Examples: Tech Stocks Currently or Recently Showing Bullish Flag Patterns
(Disclaimer: The following analyses are for illustrative purposes based on typical chart patterns as of mid-2026 and are not direct investment advice.)
The tech sector is ripe with examples of bullish flag patterns due to its inherent volatility and trend-driven nature. Companies at the forefront of innovation often experience sharp rallies followed by brief periods of consolidation.
Analysis of Stock A (e.g., GOOGL)
In early 2026, Alphabet Inc. (GOOGL) experienced a sharp rally following a breakthrough in its AI division. The stock surged from $180 to $220 in just a few weeks, forming a clear flagpole. Subsequently, the price consolidated in a tight, downward-sloping channel between $210 and $218 for about three weeks on diminishing volume. The eventual breakout above $218, confirmed by a spike in trading activity, signaled a continuation of its uptrend.
Analysis of Stock B (e.g., Dell)
Dell Technologies (DELL) showcased a classic bullish flag pattern after announcing stronger-than-expected demand for its AI-enabled servers. The flagpole was a rapid move from $140 to $175. The flag formed as the stock pulled back modestly to the $165 level over two weeks. Traders who identified this pattern were prepared for the breakout above the flag’s resistance, which propelled the stock towards new highs.
Analysis of Stock C (e.g., Micron)
Micron Technology (MU), a key player in the semiconductor space, often exhibits such patterns. Following a positive industry forecast, MU’s stock created a flagpole by rallying from $130 to $155. The flag was a shallow pullback that held neatly above the key $148 support level. The subsequent breakout was a textbook example of how this pattern can foreshadow a powerful continuation move in a leading tech stock.
Trading Strategies for the Bullish Flag Pattern
Successfully trading bullish flag breakouts requires a well-defined plan that covers entry, risk management, and profit-taking. A disciplined approach transforms pattern recognition from a simple observation into a profitable strategy. Mastering these techniques is part of a comprehensive approach to the markets, similar to what’s covered in basic and advanced trading strategies.
Setting Entry Points on the Breakout
🎯 The standard entry point for a bullish flag pattern is on the breakout. A trader would typically place a buy order slightly above the upper trend line of the flag. For example, if the top of the flag’s resistance is at $105, an entry could be set at $105.10. This ensures that the trade is only triggered if there is sufficient upward momentum to confirm the breakout.
Placing Stop-Loss Orders to Manage Risk
🛡️ Effective risk management for flag patterns is non-negotiable. A stop-loss order should be placed to protect against a failed pattern or a false breakout. The most common location for a stop-loss is just below the lowest point of the flag’s consolidation. This level represents a clear point of invalidation; if the price breaks below the flag, the bullish thesis is no longer valid, and the position should be closed to minimize losses.
Calculating Price Targets for Profit-Taking
A common method for setting a price target is the ‘measured move’ technique. This involves measuring the height of the initial flagpole and adding that amount to the breakout point. For instance:
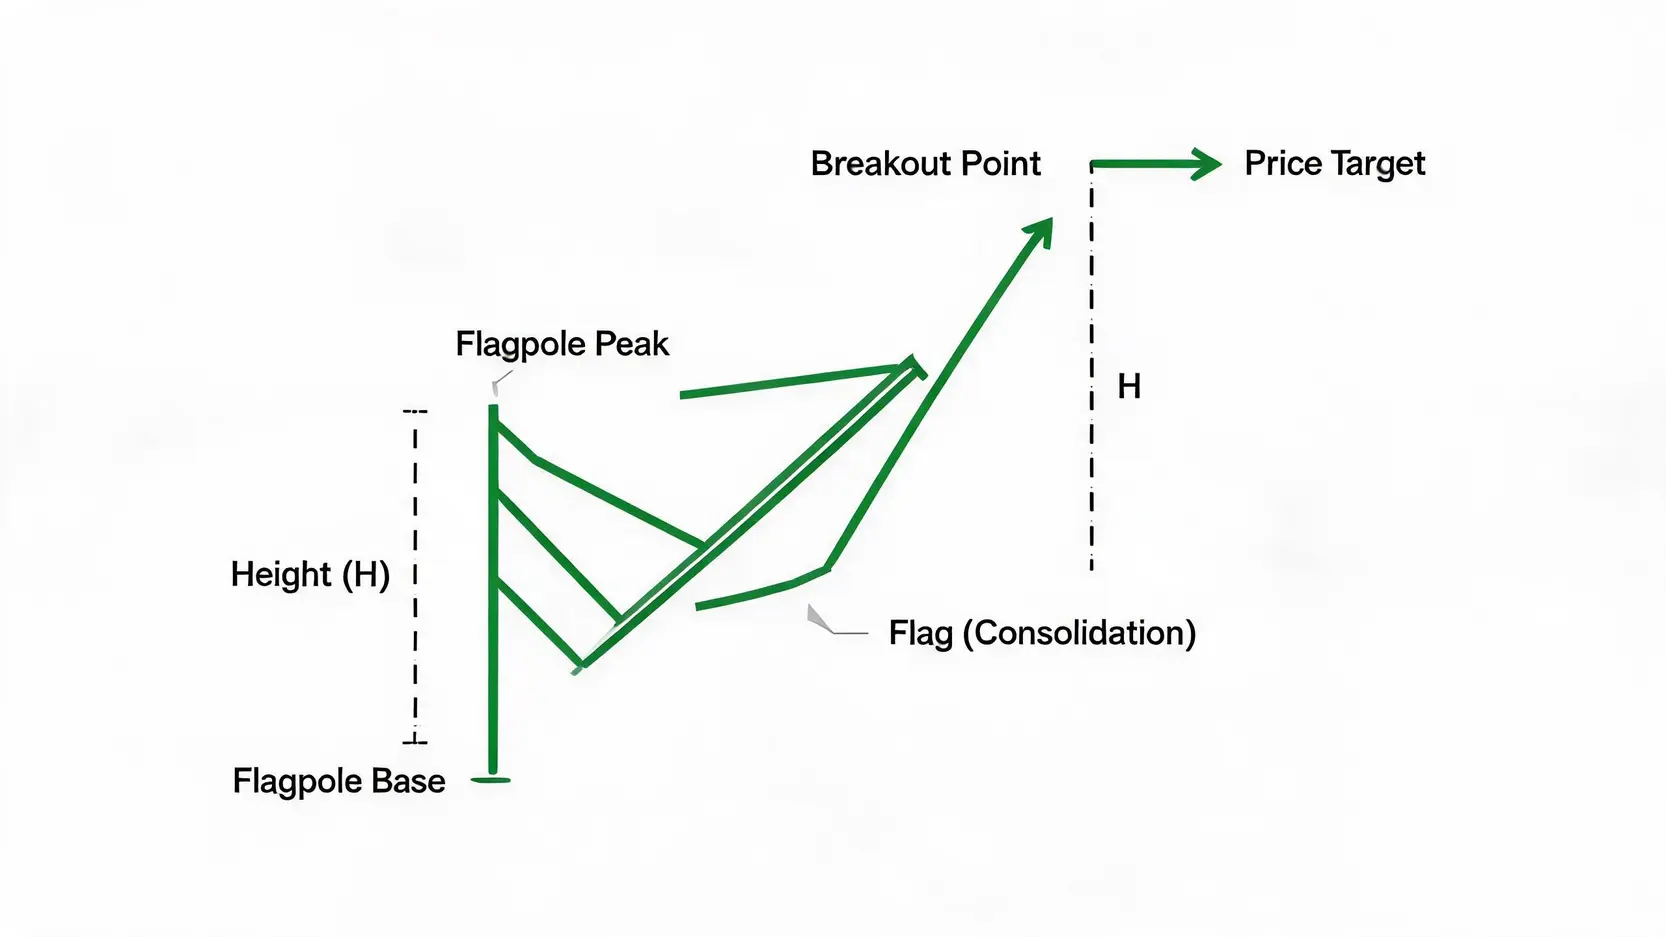
- Flagpole Start: $80
- Flagpole End: $100
- Flagpole Height: $20
- Breakout Point: $98
- Price Target: $98 + $20 = $118
This method provides a logical and data-driven target for taking profits, though traders should always adapt based on evolving market conditions.
Conclusion
The bullish flag pattern is a powerful tool in a technical trader’s arsenal, especially within the dynamic tech sector. It provides a clear visual signal of a potential trend continuation, allowing traders to enter positions with a favorable risk-to-reward ratio. By learning to identify the key components—the strong flagpole, the orderly consolidation, and the confirming volume signature—you can position yourself to capitalize on the market’s strongest trends. Remember, success lies not just in recognizing the pattern but in executing a disciplined trading strategy with clear entry, stop-loss, and profit-taking rules. Now is the time to start analyzing charts and honing your ability to spot this valuable formation.
Frequently Asked Questions (FAQ)
Q: What is the difference between a bull flag and a bear flag?
A: They are mirror images. A bull flag is a continuation pattern that appears during a strong uptrend and signals a likely continuation of that upward move. Conversely, a bear flag appears during a strong downtrend and signals that the downward move is likely to resume after a brief pause.
Q: How reliable is the bullish flag pattern?
A: The bullish flag is considered one of the more reliable continuation patterns, but no pattern is foolproof. Its reliability increases significantly when confirmed by other factors, especially trading volume. A breakout on high volume is a much stronger signal than one on low volume. Context, such as the overall market trend and sector strength, also plays a vital role in the pattern’s success rate.
Q: What timeframe is best for identifying bull flags in tech stocks?
A: Bull flags can form on any timeframe, from intraday charts (like the 5-minute or 15-minute) to long-term charts (daily, weekly). For most stock traders, the daily and 4-hour charts provide a good balance, allowing enough time for the pattern to form clearly without being overly influenced by short-term market noise. The choice of timeframe should align with your trading style (e.g., day trading vs. swing trading).
Q: What happens if a bull flag pattern fails?
A: A failed bull flag occurs when the price breaks down below the lower support of the flag instead of breaking out to the upside. This is a bearish signal and often indicates that the uptrend is exhausted and a potential reversal is underway. This is precisely why having a pre-defined stop-loss order is crucial for risk management.