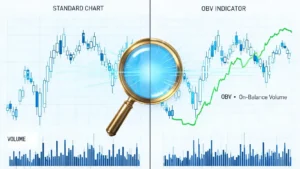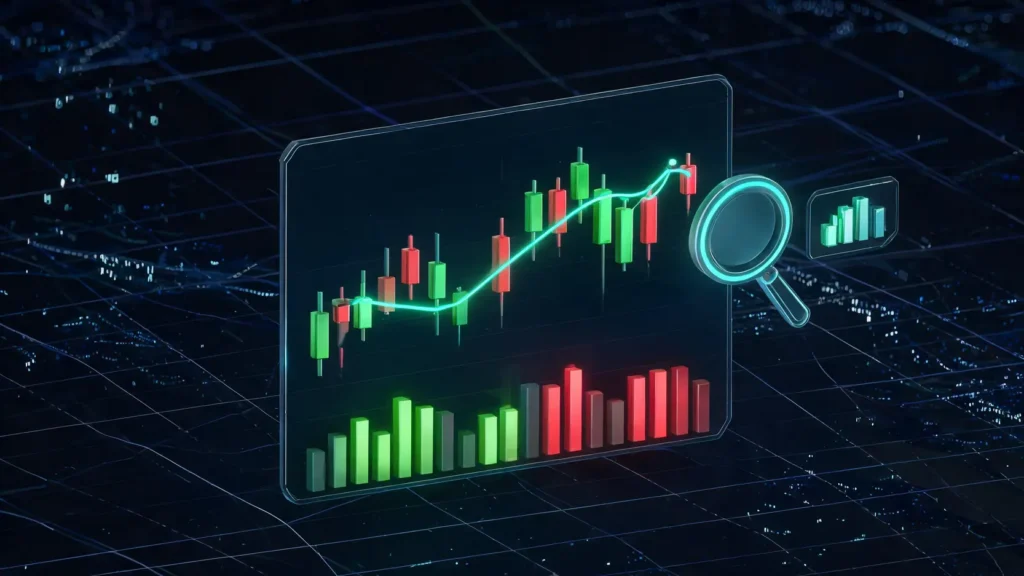
The volume price relationship in trading is a foundational concept that helps traders gauge the conviction behind market movements. While price action indicates the direction of a trend, volume reveals the level of participation and enthusiasm driving it. A price rise accompanied by strong volume suggests robust buying interest, whereas a similar rise on weak volume may signal fading momentum.
This comprehensive guide provides a practical framework for interpreting price-volume behaviour, confirming trend strength, identifying potential reversals, and avoiding common analytical errors.
Table of Contents
What Is the Volume Price Relationship in Trading?
The core concept is that volume acts as a confirmation tool for price. The volume price relationship in trading examines the number of shares or contracts traded over a specific period relative to the price movement during that same period.
It provides critical context, helping traders differentiate between a sustainable trend supported by broad market participation and a temporary fluctuation driven by minimal interest. Understanding this dynamic is crucial for making informed trading decisions.
The Role of Price: Direction and Emotion
Price is the most immediate indicator of market activity, representing the consensus value of an asset at any given moment. It charts the path of market direction, forming trends, support levels, and resistance zones. Price action reflects the collective psychology of all market participants—their fear, greed, and uncertainty. However, price alone does not tell the whole story; it shows what happened, but not necessarily how much conviction was behind the move.
The Role of Volume: Participation and Conviction
Volume quantifies the level of market participation. For equities, it is the number of shares traded; for futures, it is the number of contracts. High volume signifies a high level of interest and activity, indicating that a significant number of traders are actively buying and selling. This suggests that the corresponding price move has weight and conviction.
Conversely, low volume indicates limited interest, and any price movement occurring on low volume may be less significant and more susceptible to a reversal. Therefore, analysing volume is essential to validate the strength of a price trend.
Why This Relationship is a Key Confirmation Tool
The volume price relationship in trading should not be used as a standalone signal generator. Instead, its primary function is to confirm or question the validity of signals from other forms of analysis, such as chart patterns or indicators.
For instance, a breakout from a consolidation pattern is far more reliable if it occurs on a surge of volume compared to one that happens on below-average volume. The latter often turns out to be a ‘false breakout’. By using volume as a secondary layer of analysis, traders can filter out weaker signals and focus on higher-probability opportunities.
The Four Core Price and Volume Signals Every Trader Must Know
There are four primary combinations in the volume price relationship in trading that provide distinct market insights. A trader’s ability to identify and correctly interpret these signals can significantly enhance their market analysis. Each scenario offers a clue about the underlying strength or weakness of the current price action, guiding traders on whether to trust or question the prevailing trend.
| Signal Combination | Market Implication | What to Watch For |
| Price Up, Volume Up | Bullish; confirms uptrend strength. | Continuation of the uptrend, potential breakouts. |
| Price Up, Volume Down | Bearish warning; suggests weakening momentum. | Potential for reversal or consolidation; divergence. |
| Price Down, Volume Up | Bearish; confirms downtrend strength. | Continuation of the downtrend, potential breakdowns. |
| Price Down, Volume Down | Bullish warning; suggests weakening selling pressure. | Potential for a bottom or relief rally; divergence. |
Signal 1: Price Up, Volume Up (Confirmation of Uptrend)
This is the healthiest sign for a bullish trend. When prices are rising and trading volume is also increasing, it indicates that a growing number of participants are willing to buy the asset at progressively higher prices. This alignment suggests strong conviction and supports the continuation of the uptrend. Traders view this as a confirmation that institutional capital and broad market interest are likely behind the move.
Signal 2: Price Up, Volume Down (Weakening Momentum)
When prices continue to rise but volume begins to decline, it serves as a warning sign. This divergence suggests that fewer participants are driving the price higher, and the conviction behind the uptrend is waning. While it does not guarantee an immediate reversal, it indicates that the trend is becoming exhausted and vulnerable. Traders should become more cautious, perhaps by tightening stop-losses or avoiding new long positions until volume confirms further price advances.
Signal 3: Price Down, Volume Up (Confirmation of Downtrend)
This combination is strongly bearish. When prices are falling on increasing volume, it signals that selling pressure is intensifying. More participants are eager to sell, even at lower prices, which confirms the strength of the downtrend. This scenario often occurs during sharp market declines or after a break of a key support level. It indicates a high degree of consensus among traders that the asset’s value is likely to fall further.
Signal 4: Price Down, Volume Down (Weakening Selling Pressure)
If prices are declining but volume is also diminishing, it suggests that the selling pressure is easing. Fewer participants are willing to sell at these lower levels, which may indicate that the downtrend is losing its momentum. This is not an immediate buy signal, but it is a sign that the market may be approaching a bottom or is due for a consolidation phase or a relief rally. Traders should look for other bullish confirmations, such as price forming a base or breaking a short-term resistance level.
How to Use Volume to Confirm Trend Strength and Breakouts
Volume is indispensable for validating the health of a trend and the legitimacy of breakouts. A sustainable trend has a characteristic volume pattern, and a genuine breakout is almost always accompanied by a significant increase in trading activity. By analysing these patterns, traders can build greater confidence in their assessment of the market’s direction.
Analysing Volume in a Healthy Uptrend vs a Weak Uptrend
In a healthy, sustainable uptrend, volume should expand during rallies (impulse moves) and contract during pullbacks (corrective moves). This pattern shows that buying interest is strong when the price moves in the direction of the trend, and selling pressure is weak during counter-trend corrections.
In contrast, a weak uptrend may exhibit declining volume on new price highs, a key divergence that signals underlying fragility. The consistent failure of volume to confirm price highs is a red flag that the trend may be nearing its end.
Confirming Bearish Pressure in a Downtrend
Similarly, a robust downtrend is characterised by higher volume on down moves and lower volume during relief rallies. This indicates strong conviction among sellers and a lack of significant buying interest to challenge the prevailing trend. If a downtrend starts to show diminishing volume on declines and increasing volume on rallies, it suggests the balance of power may be shifting, and the bearish momentum is fading.
The Importance of Above-Average Volume in Breakouts
A breakout occurs when an asset’s price moves decisively through a defined level of support or resistance. The most reliable breakouts are accompanied by a sharp increase in volume—often several times the recent average. This volume surge signifies a strong consensus and commitment from market participants, suggesting the new price level is likely to hold.
To quantify this, traders often compare the breakout day’s volume to a moving average of volume (e.g., a 50-day average). A breakout on low volume is highly suspect and has a greater probability of failing.
Price and Volume Divergence: A Critical Warning Signal
Divergence occurs when price and volume move in opposite directions, providing a powerful warning that a trend’s momentum is weakening. This discrepancy between price action and market participation is a crucial element of the volume price relationship in trading and can often foreshadow a significant trend change or reversal.
What is Bullish and Bearish Divergence?
Bearish Divergence: This occurs in an uptrend when the price makes a new high, but the volume on that new high is lower than the volume on a previous high. This indicates that the enthusiasm to buy at higher prices is fading, making the uptrend vulnerable.
Bullish Divergence: This happens in a downtrend when the price makes a new low, but the volume on that low is lighter than on a previous low. It suggests that selling pressure is drying up and the downtrend may be losing its power.
Case Study: Spotting a Potential Reversal with Divergence
Imagine a stock has been in a strong uptrend for several months. It pushes to a new 52-week high of £100 on strong volume. After a minor pullback, it rallies again to £105. However, the volume recorded on the day it hits £105 is only half of what it was at the £100 peak. This is a classic case of bearish divergence. While the price is higher, the participation is significantly lower, suggesting the move is not well-supported and could be susceptible to a sharp pullback or reversal.
Why Divergence is Not a Standalone Sell or Buy Signal
It is critical to understand that divergence is a warning, not an explicit trading signal. A trend can continue for an extended period with diverging volume before it finally reverses. Therefore, traders must use divergence in conjunction with other technical tools.
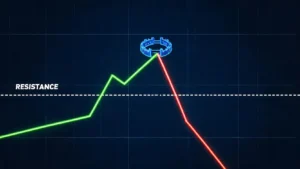
For example, a bearish divergence becomes much more potent if it occurs as the price approaches a major resistance level or is accompanied by a bearish candlestick pattern like a shooting star or engulfing candle. Effective risk management remains paramount.
5 Common Mistakes to Avoid When Reading Price and Volume
While the volume price relationship in trading is a powerful analytical tool, several common mistakes can lead to flawed conclusions. Avoiding these pitfalls is essential for accurately interpreting market behaviour and making sound trading decisions.
Mistake 1: Assuming All High Volume is Bullish
High volume does not always signal strength in the direction of the current price move. A massive volume spike at the top of a prolonged uptrend, known as a ‘buying climax’ or ‘exhaustion volume’, can signal the final wave of buyers entering the market just as smart money begins to sell.
Similarly, a ‘selling climax’ can occur at the bottom of a downtrend, marking capitulation. The context of where the volume occurs is more important than the volume figure itself.
Mistake 2: Ignoring the Context of Volume Spikes (News & Events)
Volume can surge for reasons unrelated to organic trend strength. Major news announcements, such as corporate earnings reports, central bank interest rate decisions, or significant geopolitical events, can cause temporary, event-driven volume spikes. It is crucial to distinguish this type of volume from the activity that builds and sustains a trend. Traders should always be aware of the economic calendar to contextualise unusual volume behaviour.
Mistake 3: Using Volume in Isolation Without Price Action
Volume is a confirmation tool; it has little predictive power on its own. A high volume reading is meaningless without reference to what the price is doing. Is the price breaking out, reversing, or consolidating? The volume price relationship in trading is a two-part equation. Always start with price analysis—identifying trends, support, and resistance—and then use volume to confirm or refute your hypothesis.
Mistake 4: Misinterpreting Tick Volume in Forex Trading
The foreign exchange market is decentralised, meaning there is no central exchange to report total trading volume. Most retail forex platforms provide ‘tick volume’, which measures the number of price changes (ticks) during a period, not the actual number of contracts or currency units traded.
While tick volume can be a useful proxy for activity, it is not the same as the true volume seen in equity or futures markets. Traders must understand this limitation and use tick volume with caution, recognising that it reflects activity levels rather than actual transactional size.
Conclusion
The volume price relationship in trading is an essential skill for any serious market analyst. It provides a deeper layer of insight into market dynamics that price alone cannot offer. By learning to interpret how volume confirms trends, signals exhaustion, and validates breakouts, traders can significantly improve their ability to filter for high-quality setups and manage risk more effectively.
The most robust trading strategies combine analysis of price structure, volume confirmation, key support and resistance levels, and disciplined risk management. The ultimate question is not whether volume is high or low, but whether it validates or contradicts the story that price is telling.
Frequently Asked Questions (FAQ)
What does volume price relationship mean in trading?
The volume price relationship in trading refers to the method of analysing an asset’s price movement in conjunction with its trading volume. It is used to assess the strength or weakness of a price trend and to confirm whether market participation supports the move. A strong relationship validates the trend, while a weak one can signal a potential reversal.
Is rising price with rising volume always bullish?
Generally, rising price with rising volume is a bullish sign that confirms the strength of an uptrend. However, context is crucial. If this occurs after a very extended rally, it could signal an exhaustion climax where late buyers are trapped. It is most bullish during the initial phases of a trend or when breaking out of a consolidation pattern. Always consider the broader market structure and proximity to major resistance levels.
What does rising price with falling volume mean?
Rising price with falling volume is a bearish divergence and a warning sign. It suggests that fewer participants are willing to buy at higher prices, indicating that the conviction behind the uptrend is weakening. This makes the trend more vulnerable to a reversal or a significant pullback, as there is less support to absorb any selling pressure.
Can volume predict price movement?
Volume itself does not predict future price movements with certainty. Its role is not predictive but confirmative. It provides crucial context about the health and momentum of the current price trend. By showing the level of participation, volume helps traders gauge the probability of a trend continuing or reversing. It is most powerful when used as part of a comprehensive trading plan that includes price action analysis and risk management.