The S&P 500 is entering July 2026 on an impressive 11-year winning streak for the month, a powerful S&P 500 seasonal trend that has captured the attention of investors worldwide. For over a decade, July has consistently delivered positive returns, creating a phenomenon often dubbed the ‘July Effect’. But as every seasoned analyst knows, past performance is not a guarantee of future results. The critical question now is whether this historic run can survive the unique economic landscape of 2026. This article dissects the data behind the S&P 500 11-year July winning streak, analyzes the key economic factors in play for July 2026, and explores whether the market can defy the odds to secure a twelfth consecutive year of gains.
Table of Contents
Understanding the S&P 500’s Remarkable July Performance
The consistent positive performance of the S&P 500 in July is more than just a statistical coincidence; it’s a recognized market pattern. This section delves into the historical data to quantify this trend and provide a foundation for our analysis.
What is the ‘July Effect’?: A Historical Overview Since 2015
The ‘July Effect’ refers to the observed tendency for the stock market, particularly the S&P 500, to exhibit strong performance during the month of July. This pattern is attributed to a confluence of factors, including the start of the second half of the year, which often brings fresh capital inflows from institutional investors, and a general sense of summer optimism. Since 2015, this effect has been remarkably consistent, with the index navigating various economic climates—from periods of monetary tightening to global trade disputes—yet still managing to end the month in positive territory each year. This consistency makes the S&P 500 July returns a focal point for market strategists.
By the Numbers: A Year-by-Year Look at S&P 500 July Returns
To fully appreciate the strength of this streak, a quantitative look is essential. The performance has been robust, demonstrating the market’s resilience during this specific month. Here is a breakdown of the S&P 500’s returns in July for each year of the winning streak, sourced from historical market data.
| Year | S&P 500 July Return |
|---|---|
| 2015 | +1.97% |
| 2016 | +3.56% |
| 2017 | +1.93% |
| 2018 | +3.60% |
| 2019 | +1.31% |
| 2020 | +5.51% |
| 2021 | +2.27% |
| 2022 | +9.11% |
| 2023 | +3.11% |
| 2024 | +1.58% |
| 2025 | +2.52% |
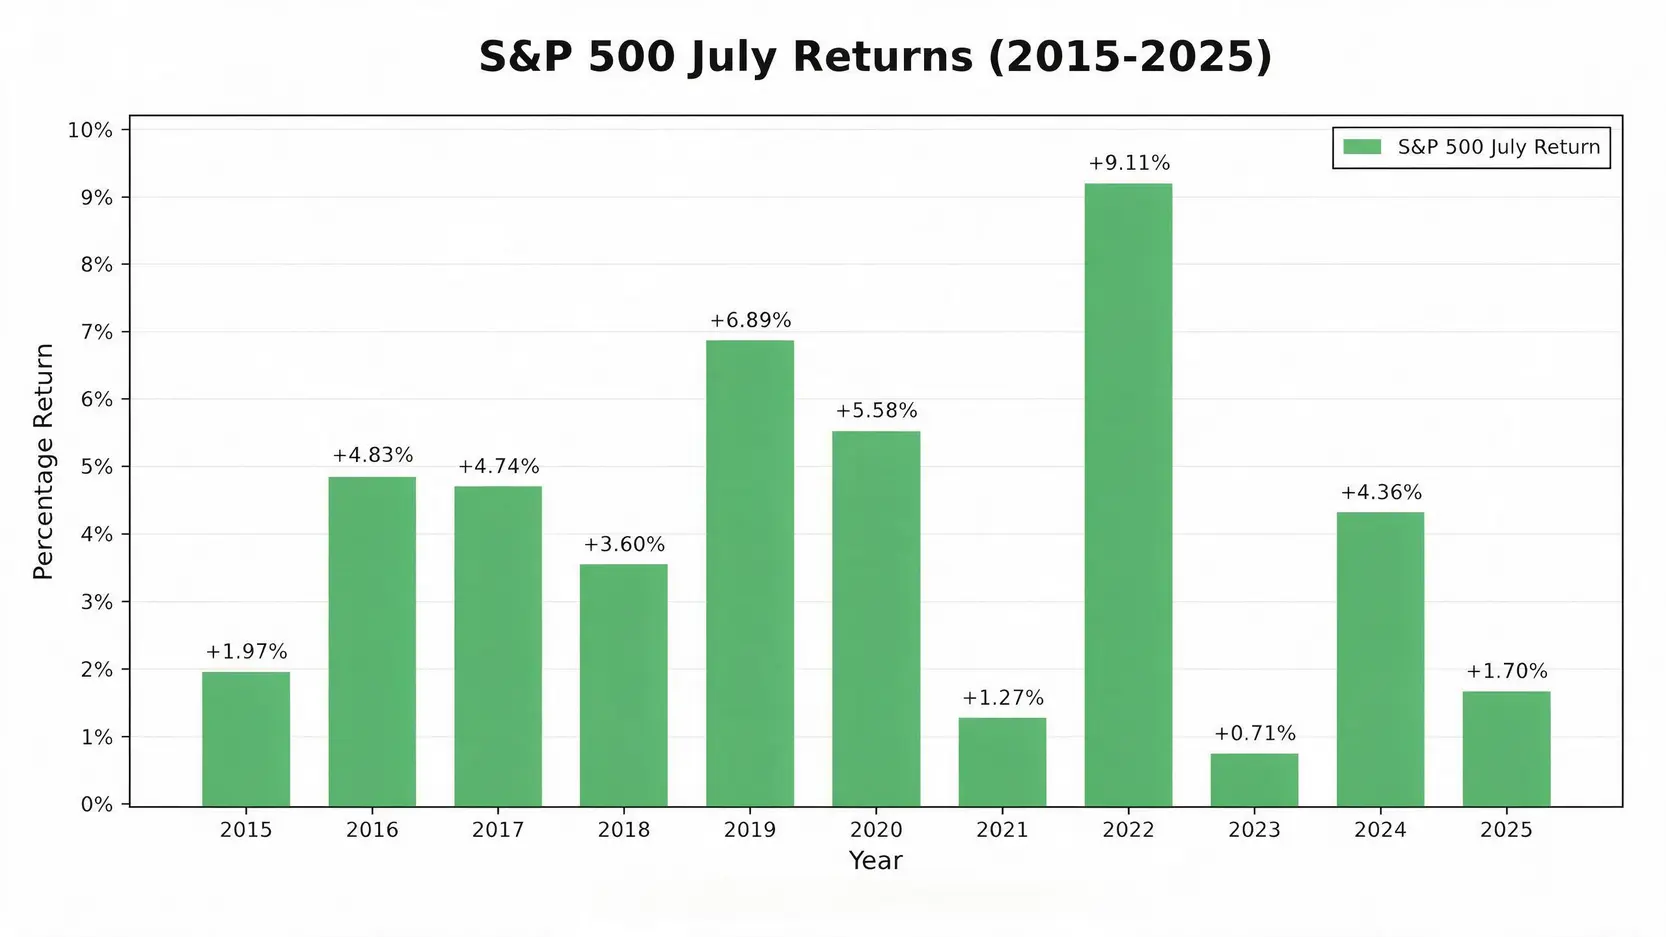
The data clearly illustrates a powerful trend, but it’s crucial to analyze the present context rather than relying solely on history.
Key Factors That Will Decide July’s Outcome for the Stock Market
While historical data provides a compelling backdrop, the fate of the July 2026 streak hinges on a few critical, forward-looking indicators. This month, all eyes will be on inflation data and the second-quarter earnings season.
The Inflation Question: How Will the July CPI Report Influence the Market?
Inflation remains a pivotal factor for market direction. The upcoming Consumer Price Index (CPI) report, scheduled for release in the second week of July, will be intensely scrutinized. After a period of stubborn inflation, the Federal Reserve has signaled a data-dependent approach. A cooler-than-expected CPI reading could ignite a rally, as it would increase the probability of a pause or even a dovish pivot in monetary policy. Conversely, a hot inflation print could spook investors and apply significant downward pressure on equities, potentially ending the streak. For the most accurate and up-to-date information, investors should refer directly to the U.S. Bureau of Labor Statistics, the official source for CPI data.
Earnings Season Spotlight: Can Q2 Corporate Profits Justify Current Valuations?
July also marks the heart of the Q2 earnings season. With the S&P 500 trading at elevated valuation multiples, the pressure is on for companies to deliver strong profits and, more importantly, optimistic forward guidance. Analysts will be parsing reports from market bellwethers for signs of margin compression, consumer demand resilience, and the impact of higher interest rates. If corporate America can demonstrate robust financial health, it will provide fundamental support for current market levels and could propel the index to another monthly gain. However, any widespread earnings misses or cautious outlooks could trigger a valuation reset. 📉
🆕 Analysis: Will the Winning Streak Survive 2026?
Weighing the historical trend against the current economic climate requires a balanced view. Both bullish and bearish scenarios have merit, and understanding them is key to navigating the month ahead.
The Bull Case: Arguments for a 12th Consecutive Win
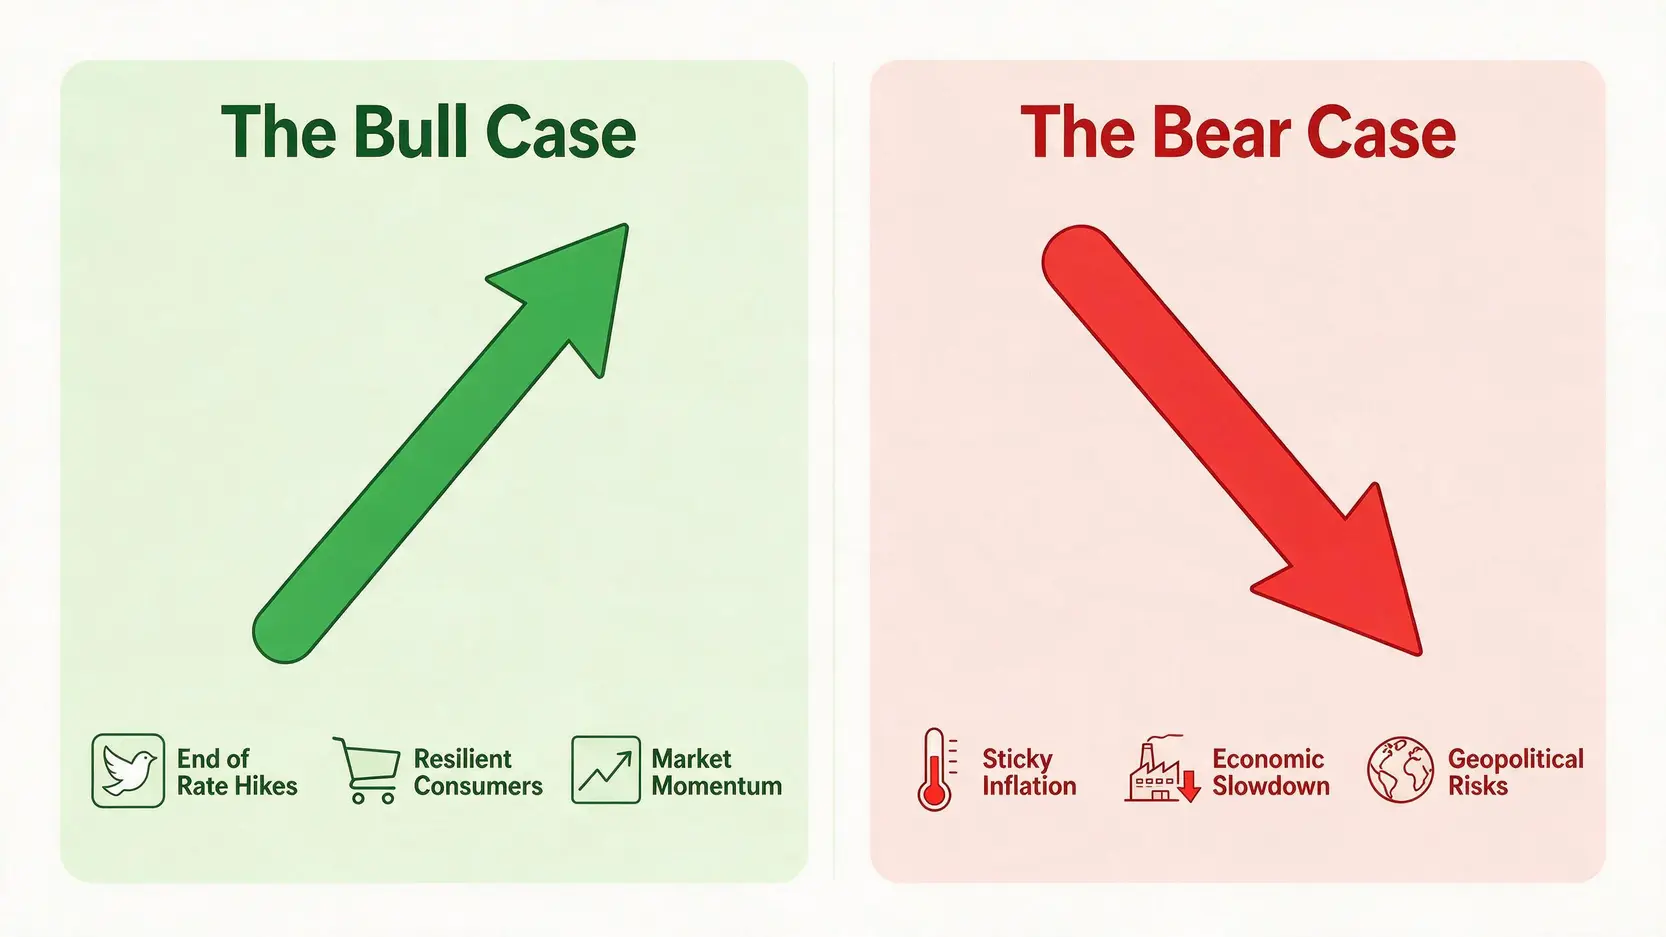
Several factors support the continuation of the July winning streak. Firstly, the market may be pricing in the end of the Fed’s rate-hiking cycle, which would be a significant tailwind for equities. Secondly, consumer balance sheets, while showing some strain, have remained surprisingly resilient, supporting corporate revenues. Finally, the powerful force of market momentum and positive sentiment associated with the ‘July Effect’ cannot be underestimated. If economic data comes in just right—not too hot to alarm the Fed, not too cold to signal a recession—the path of least resistance could be higher. 📈
The Bear Case: Major Risks That Could Break the Streak
Conversely, significant risks loom. A primary concern is that inflation proves stickier than anticipated, forcing the Federal Reserve to maintain its hawkish stance or even resume tightening. Furthermore, the full impact of previous rate hikes may not have fully filtered through the economy, creating the risk of a sudden economic slowdown or an ‘earnings recession.’ Geopolitical uncertainty also remains a persistent wildcard. A prudent approach involves a solid understanding of investment risk management to prepare for potential volatility.
Valuation Concerns: Is the Market Overheated for Another Rally?
After a strong first half of 2026, S&P 500 valuations are a point of contention. The forward Price-to-Earnings (P/E) ratio is sitting above its historical average, suggesting that much of the good news is already priced in. For the market to rally further, it needs a fresh catalyst, such as blockbuster earnings or a definitive all-clear signal on inflation. Without it, the market may be vulnerable to a period of consolidation or a pullback, making a twelfth consecutive July win a challenging feat.
Conclusion
The S&P 500’s 11-year July winning streak is a compelling historical trend that highlights a significant seasonal anomaly. However, as we stand in July 2026, the market faces a unique set of challenges and opportunities. The interplay between the upcoming CPI data and the Q2 corporate earnings reports will be decisive in determining the market’s direction. Whether the streak extends to a remarkable twelfth year or succumbs to economic pressures, a disciplined and data-driven approach remains an investor’s most valuable asset. Monitoring these key dynamics is crucial for making informed decisions in the weeks ahead.
Frequently Asked Questions (FAQ)
Q: What is the S&P 500’s longest monthly winning streak ever?
A: The S&P 500 has recorded several impressive winning streaks throughout its history. One of the most notable in recent decades was a 10-month winning streak that concluded in January 2018. The current 11-year streak for the specific month of July is a unique seasonal record.
Q: Which month is historically the best for the S&P 500?
A: While performance varies year by year, historical data since the 1950s identifies several strong months. November, December, and April are often cited as having the highest average returns. July has also proven to be a particularly strong performer, especially over the last decade, contributing to the ‘July Effect’ phenomenon.
Q: How does seasonality affect stock market investing?
A: Stock market seasonality refers to recurring patterns or trends that appear at specific times of the year. These can be driven by institutional factors (like fiscal-year-end portfolio adjustments), investor psychology (the ‘Santa Claus Rally’), or economic cycles. While these seasonal trends, like the S&P 500’s July performance, can be useful for context, they are not foolproof predictors and should be used as one tool among many in a comprehensive investment strategy.
Q: What are the primary risks for the S&P 500 in the second half of 2026?
A: The primary risks heading into the latter half of the year include: 1) Persistent inflation that forces central banks to maintain tight monetary policies, 2) A potential slowdown in corporate earnings growth or an ‘earnings recession’ as economic activity cools, and 3) Elevated geopolitical tensions that could disrupt supply chains or impact energy prices. Investors must monitor these factors closely when building a long-term investment portfolio.