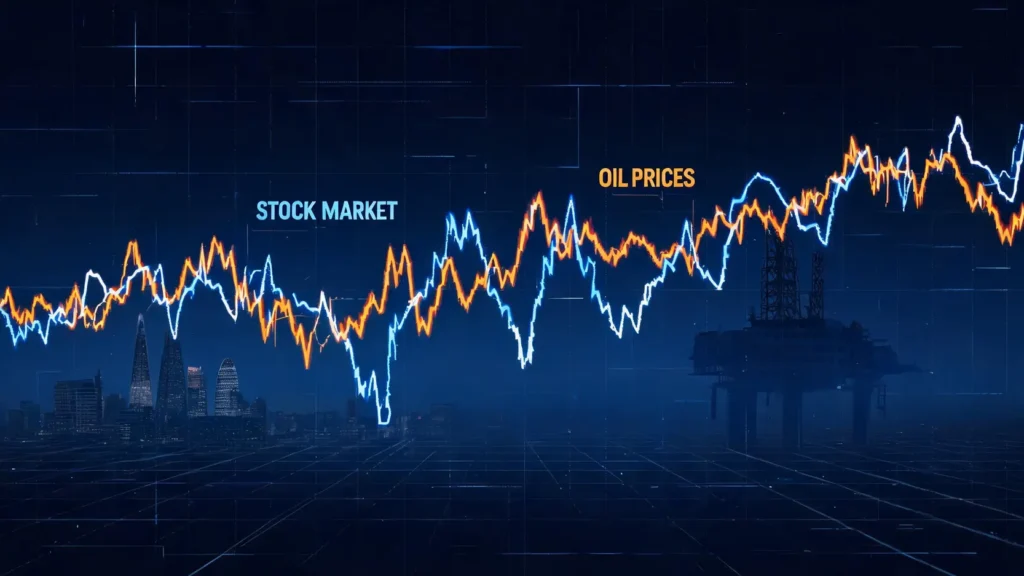
The year 2026 will be remembered as a period of significant market volatility, where the intricate dance between fluctuating oil prices and the performance of the FTSE 100 was on full display. For investors focused on the UK market, the direct impact of geopolitical events on this relationship became clearer than ever. This comprehensive analysis will dissect the key events of 2026, explore the underlying economic mechanics connecting these two market forces, and provide a strategic outlook for navigating similar conditions in the future.
Table of Contents
Key Events in 2026 That Defined the Oil and FTSE 100 Markets
The year was characterized by a series of powerful catalysts that sent ripples across both commodity and equity markets. Understanding these specific events is crucial to grasping the year’s overall market narrative and the performance of FTSE 100 constituents.
The Q1 Geopolitical Crisis: How Middle East Tensions Sent Shockwaves Through the Market
The first quarter began with heightened geopolitical tensions in the Middle East, centering around disputes in the Strait of Hormuz. Renewed sanctions and a breakdown in diplomatic talks triggered immediate fears of a supply disruption. Brent crude futures surged past $95 per barrel, causing a knee-jerk reaction in the markets. The FTSE 100, with its heavy exposure to the energy sector, initially saw its major oil companies rally. However, the broader market sentiment quickly soured as investors priced in the risk of sustained high energy costs, which threatened to stifle economic growth and fuel inflation. This period highlighted the market’s sensitivity to geopolitical shocks and reinforced the importance of understanding geopolitical risk for investors.
Mid-Year Interest Rate Decisions and Their Effect on Commodity and Equity Prices
By mid-2026, the focus shifted to monetary policy. With inflation remaining stubbornly above target, partly due to the earlier oil price spike, the Bank of England and the US Federal Reserve were forced into a hawkish stance. A series of coordinated interest rate hikes aimed at cooling the economy had a dual effect. On one hand, higher rates increased the cost of capital, putting downward pressure on equity valuations across the board. On the other, the prospect of an economic slowdown began to temper demand forecasts for oil, pulling crude prices back from their Q1 highs. This created a complex environment where the FTSE 100 was caught between the pincers of rising borrowing costs and fluctuating earnings forecasts for its key sectors.
Analysis of Major Corporate Earnings from FTSE 100 Energy Giants in 2026
The third and fourth quarters were dominated by corporate earnings reports, particularly from energy supermajors like BP and Shell. Their Q3 results reflected the high price environment of the first half of the year, with both companies posting record-breaking profits and announcing substantial share buyback programs. This provided a significant boost to the FTSE 100, given their large weighting in the index. These strong earnings demonstrated the direct profitability link between high oil prices and the performance of the UK’s leading index. However, their forward guidance was cautious, citing macroeconomic headwinds and the potential for weaker global demand, a sentiment that capped the market’s enthusiasm.
The Fundamental Connection: Why Oil Prices Dictate FTSE 100 Trends
The performance of the FTSE 100 is intrinsically linked to the price of oil due to its unique composition and the wider economic impact of energy costs. This connection goes far beyond the simple day-to-day stock movements of energy companies.
The Heavyweights: Examining the Influence of BP, Shell, and Other Energy Stocks on the Index
The FTSE 100 is a market-capitalization-weighted index, meaning the largest companies have the biggest impact on its movement. Energy giants like Shell and BP, along with major mining and materials companies, represent a substantial portion of the index’s total value. When oil prices rise, the revenues, profits, and consequently the share prices of these companies tend to increase significantly. This directly lifts the overall value of the FTSE 100. Conversely, a sharp drop in oil prices can drag the index down, even if other sectors are performing well. This heavy concentration makes the FTSE 100 particularly sensitive to the boom-and-bust cycles of the commodity markets. For those looking for portfolio exposure, a guide to investing in energy stocks can be an invaluable resource.
The Ripple Effect: How Oil Prices Impact Inflation, Consumer Spending, and Other FTSE Sectors
Beyond the direct impact on energy stocks, oil prices have a profound ripple effect across the entire economy. Here’s how it works:
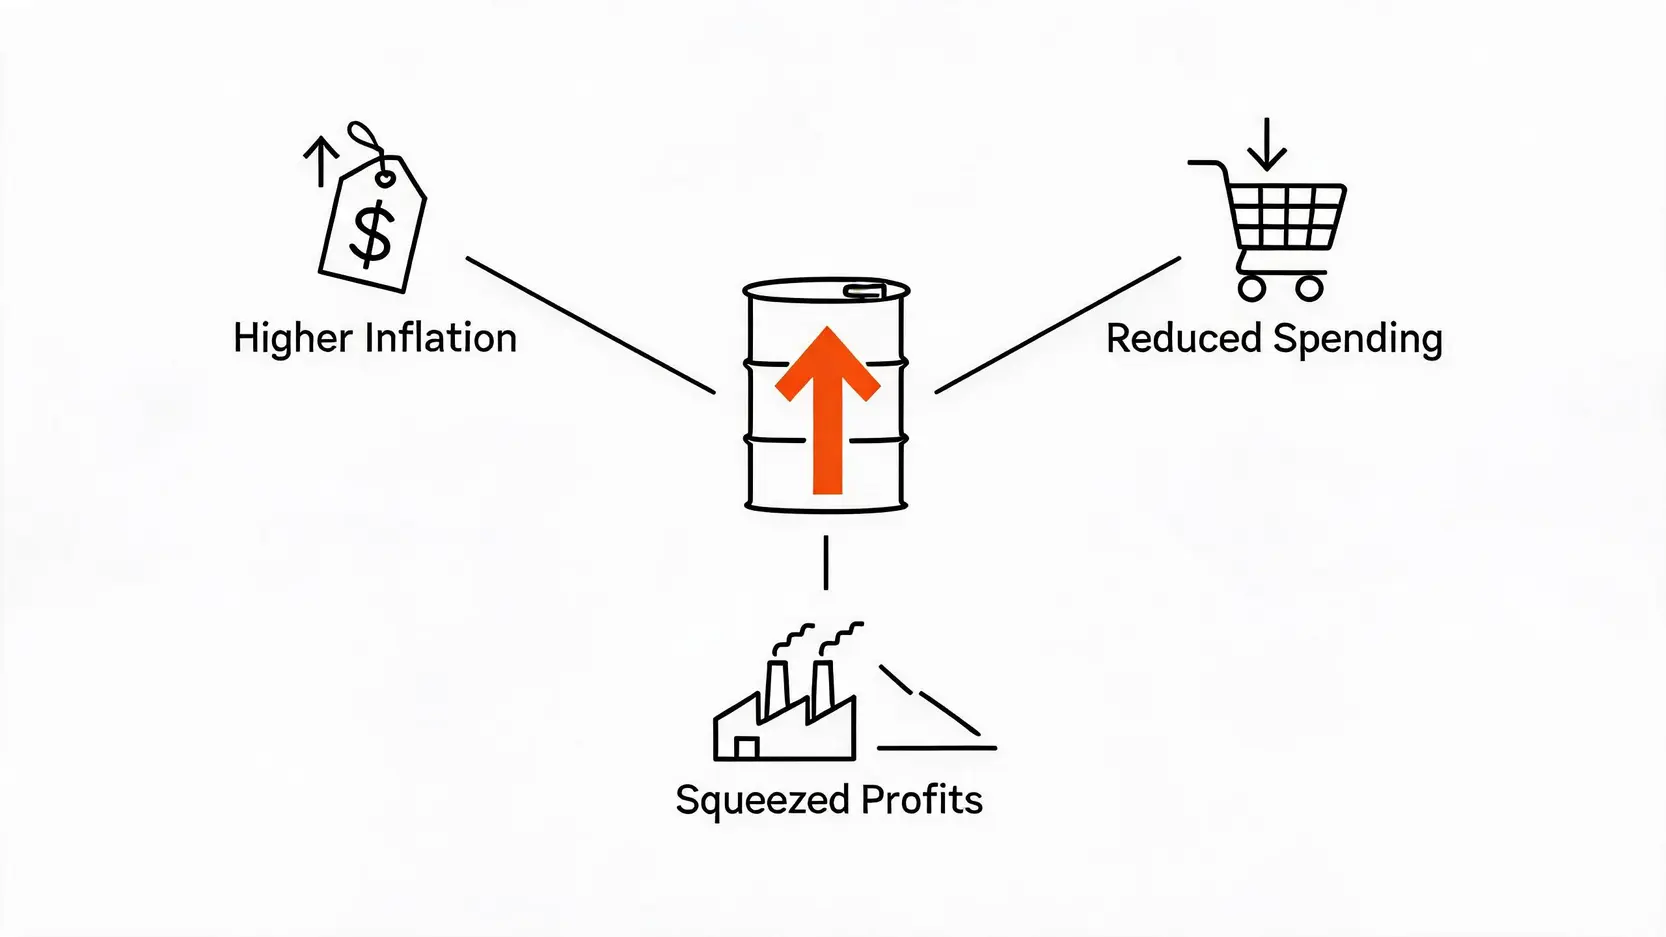
- Inflation: Energy is a primary input for almost every industry and a major component of consumer price indices. Higher oil prices lead to increased transportation, manufacturing, and utility costs, which are often passed on to consumers, driving inflation higher.
- Consumer Spending: When consumers pay more for fuel and heating, they have less disposable income for other goods and services. This directly hurts FTSE-listed companies in the retail, travel, and hospitality sectors. Airlines, for example, face a dual threat of higher fuel costs and weaker consumer demand.
- Corporate Profits: For non-energy companies, high oil prices squeeze profit margins by increasing operational costs. This can lead to lower earnings, reduced investment, and a weaker outlook, putting downward pressure on their share prices.
This intricate web of effects demonstrates that no sector is truly immune to major shifts in energy prices.
Investor’s Playbook: Navigating Market Volatility (A Look Beyond 2026)
The events of 2026 provided a masterclass in market dynamics. For astute investors, these lessons are critical for building resilient portfolios capable of withstanding future commodity-driven volatility.
Lessons Learned from 2026’s Market Behavior
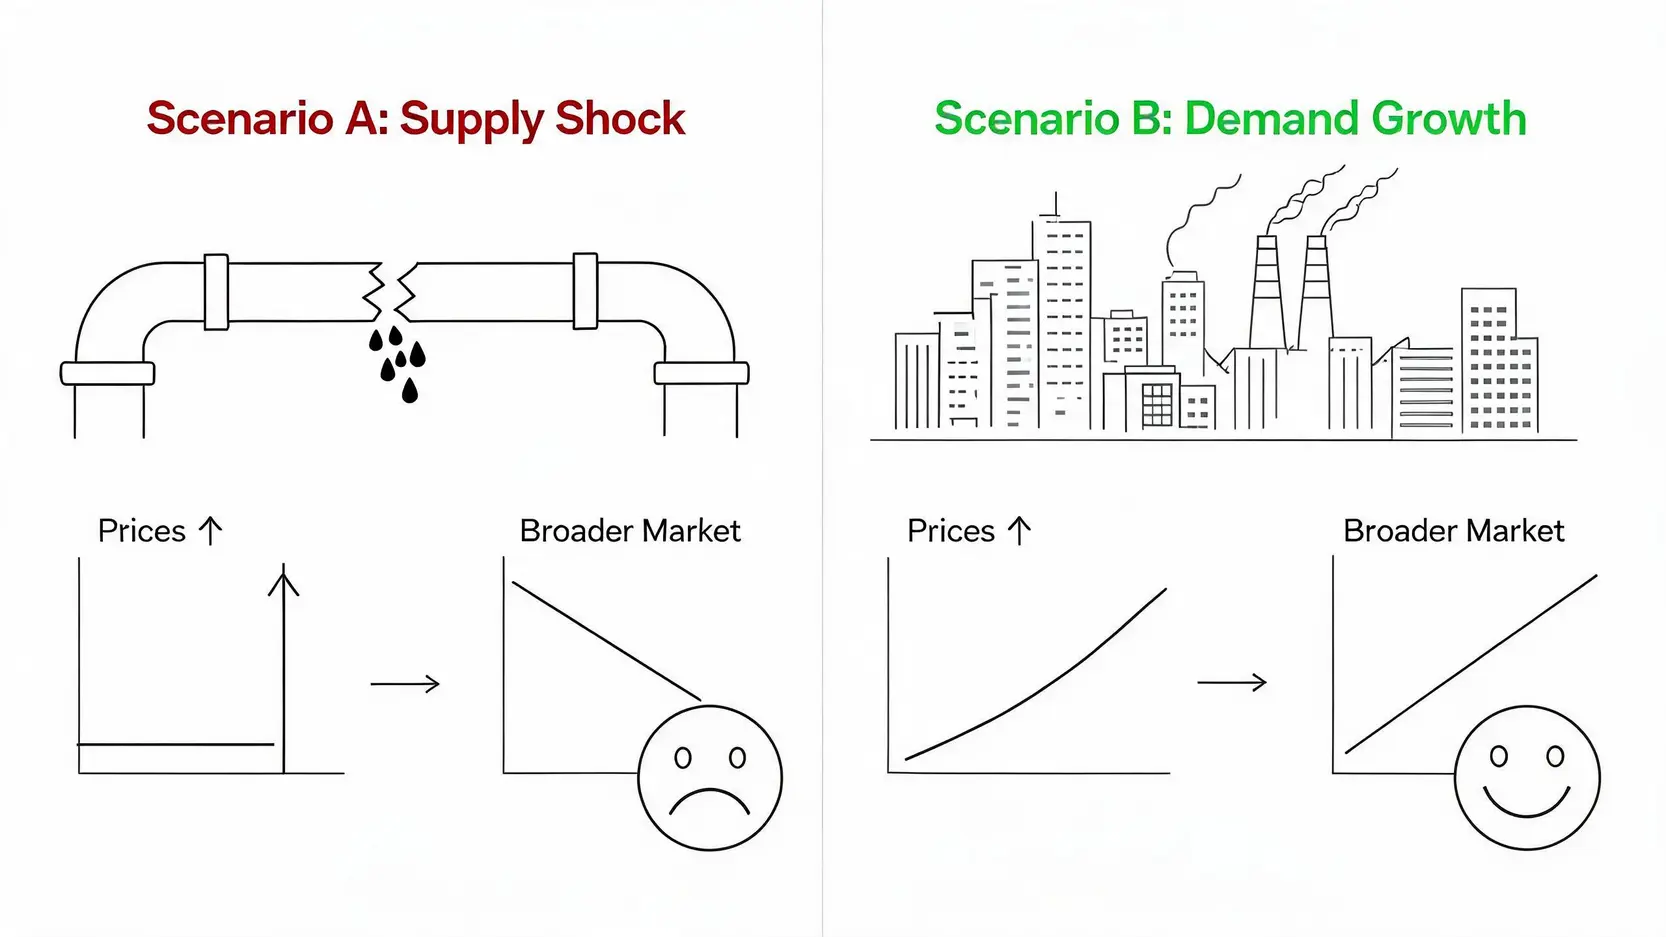
The primary lesson from 2026 is that the correlation between the FTSE 100 and oil prices is not static; it is dynamic and heavily influenced by the prevailing economic context. During the Q1 supply shock, the correlation was positive as energy giants rallied. However, as inflation and rate hike fears took hold, the relationship became more complex, with high oil prices becoming a headwind for the broader market. This underscores the need for investors to look beyond simple correlations and analyze the root causes of price movements.
Identifying Leading Indicators for Future Oil Price Movements
To stay ahead of the curve, investors should monitor a dashboard of leading indicators for the energy market. These include:
- OPEC+ Production Decisions: Announcements regarding production cuts or increases are the most direct signal of supply intentions.
- Global Inventory Levels: Data from bodies like the U.S. Energy Information Administration (EIA) provides a clear picture of the supply-demand balance. Shrinking inventories signal tighter markets and potential price increases.
- Futures Market Contango/Backwardation: The shape of the oil futures curve offers insights into market expectations for future prices.
- Global PMI Data: Purchasing Managers’ Index (PMI) readings from major economies like China and the US are a strong proxy for industrial demand.
Diversification Strategies to Mitigate Commodity-Driven Market Risk
For UK investors, whose domestic index is heavily weighted towards commodities, effective diversification is not just a recommendation—it is a necessity. The volatility of 2026 demonstrated the perils of over-concentration. Implementing robust diversification strategies is key. This can involve several approaches:
- Geographic Diversification: Investing in indices with different sectoral compositions, such as the technology-heavy Nasdaq 100 or the broad-based S&P 500, can offset the FTSE’s commodity bias.
- Sectoral Diversification: Within a UK-focused portfolio, deliberately overweighting sectors that are less correlated or even inversely correlated with energy prices, such as technology, healthcare, or certain consumer staples, can provide a valuable buffer.
- Asset Class Diversification: Including assets like government bonds, inflation-linked bonds (TIPS), and gold can provide stability during periods of equity market stress caused by commodity shocks.
Conclusion
The year 2026 served as a powerful reminder of the deep, unbreakable link between oil prices and the FTSE 100. The market’s performance was a direct reflection of the interplay between geopolitical crises, central bank policies, and the fundamental economics of energy. For any investor with exposure to the UK stock market, the key takeaway is clear: diligent monitoring of the energy markets is not just an option, but a fundamental component of sound risk management and strategic portfolio positioning. The lessons from this volatile year will undoubtedly shape investment strategies for years to come.
Frequently Asked Questions
Q: Which FTSE 100 companies are most affected by oil prices?
A: The most directly affected companies are the integrated energy giants, Shell and BP. Their revenues and profitability are tightly linked to crude oil and natural gas prices. Beyond them, the basic materials and mining sector, including companies like Glencore and Rio Tinto, are also highly sensitive to commodity price cycles. On the flip side, companies with high fuel costs, such as IAG (British Airways’ parent company) and other transportation firms, are negatively impacted by rising oil prices.
Q: Historically, how do oil price spikes impact the FTSE 100?
A: Historically, the impact depends on the driver of the price spike. If it’s driven by strong global demand, the FTSE 100 often performs well, as this signals a healthy global economy, which benefits its many multinational constituents. However, if the spike is due to a supply shock (e.g., conflict or production cuts), the impact is often negative. While energy stocks may rally, the broader market suffers from fears of inflation, higher interest rates, and a potential economic slowdown, which typically outweighs the gains from the energy sector.
Q: What were the main drivers for oil price volatility in 2026?
A: The primary drivers in 2026 were a combination of geopolitical, economic, and policy factors. The year began with a geopolitical supply-side shock stemming from tensions in the Middle East. This was followed by demand-side pressure as major central banks raised interest rates to combat inflation, stoking fears of an economic recession. Finally, corporate performance and shifting global demand forecasts in the latter half of the year added another layer of uncertainty, leading to significant price swings.