As we navigate 2026, the quest for the next market leaders intensifies, and sophisticated investors are zeroed in on Nasdaq 100 breakout stocks 2026. This index, a crucible of innovation, remains the primary hunting ground for identifying high-potential Nasdaq stocks. This guide provides a strategic, data-driven blueprint for pinpointing companies on the verge of significant growth. We will dissect the signals, analyze the underlying sector trends, and equip you with a framework for positioning your portfolio to capitalize on the opportunities that lie ahead. The goal is not just to find growth, but to identify the specific conditions that precede a powerful price acceleration, separating true breakout companies from the general market noise.
Table of Contents
Understanding the Anatomy of a Breakout Stock
Identifying potential breakout stocks requires a deeper understanding than simply chasing momentum. It involves recognizing a precise moment when a stock’s price clears a significant barrier, often heralding a new, sustained trend. This is where technical price action converges with fundamental catalysts.
What Do We Mean by a ‘Breakout’ in Trading?
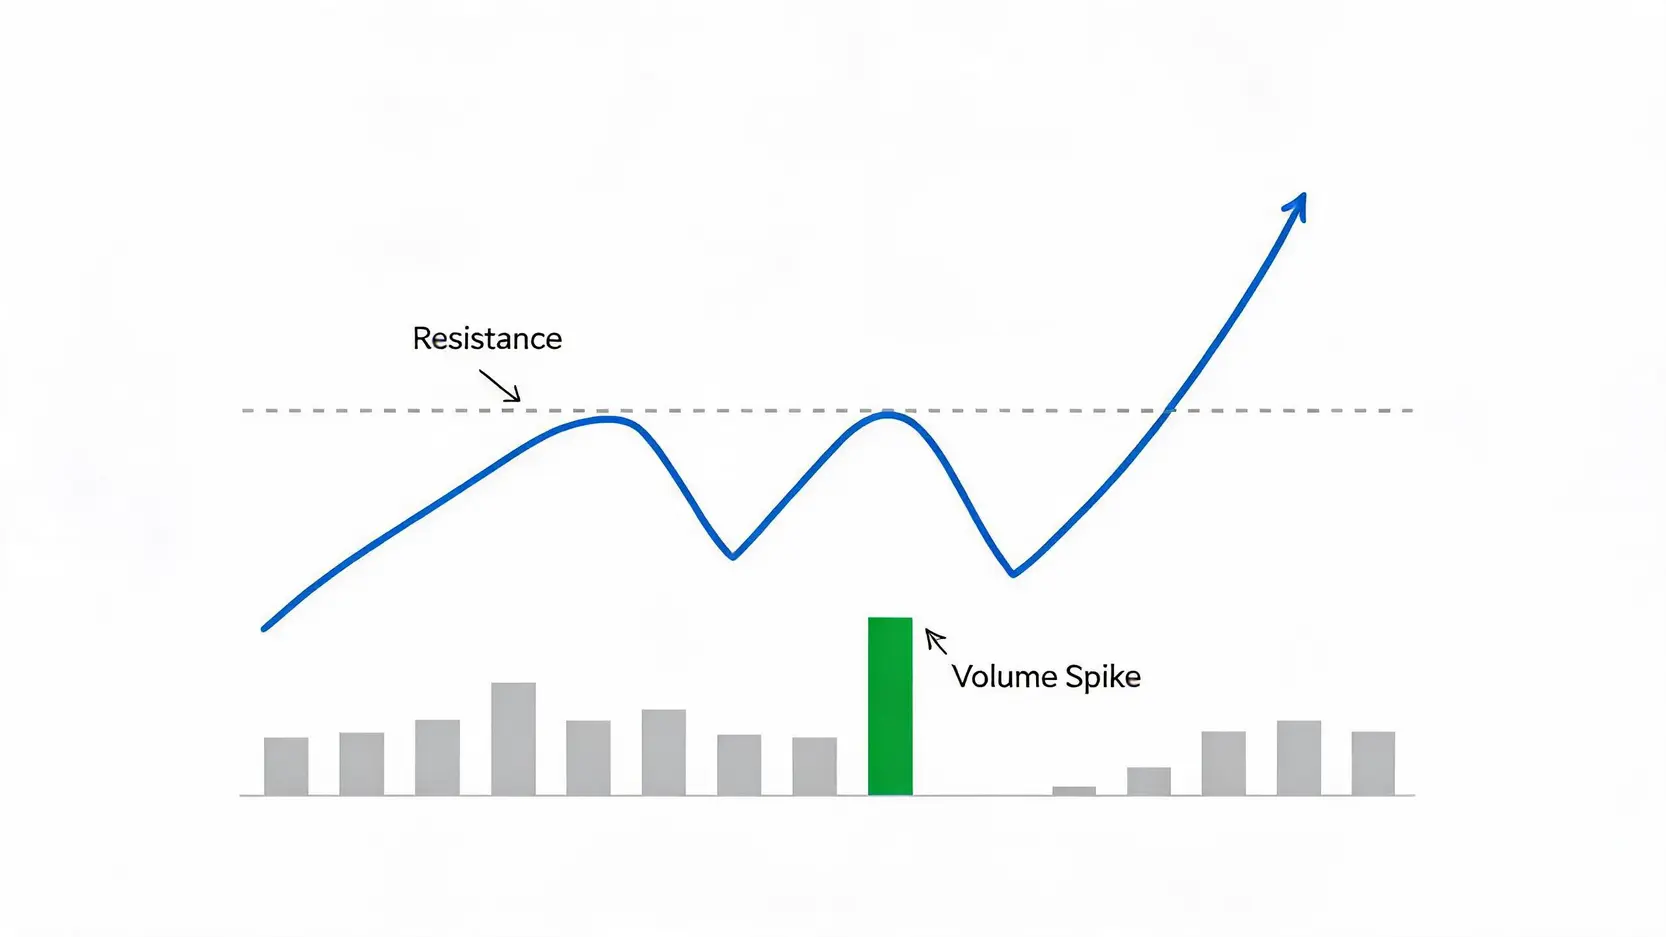
In market analysis, a ‘breakout’ is a technical term describing a price movement of a stock or asset that surpasses a defined level of resistance or support. Resistance levels are historical price ceilings where selling pressure has previously emerged, while support levels are floors where buying has stepped in. A true breakout is characterized by a decisive move through one of these barriers, almost always accompanied by a significant increase in trading volume. This surge in volume is critical; it signifies strong conviction from institutional investors and suggests the new price level is likely to hold, paving the way for a continued upward trajectory. 📈
Fundamental Catalysts vs. Technical Indicators: What to Look For
A breakout is rarely a random event. It is typically fueled by a combination of underlying business strengths and compelling technical patterns. A robust analysis considers both.
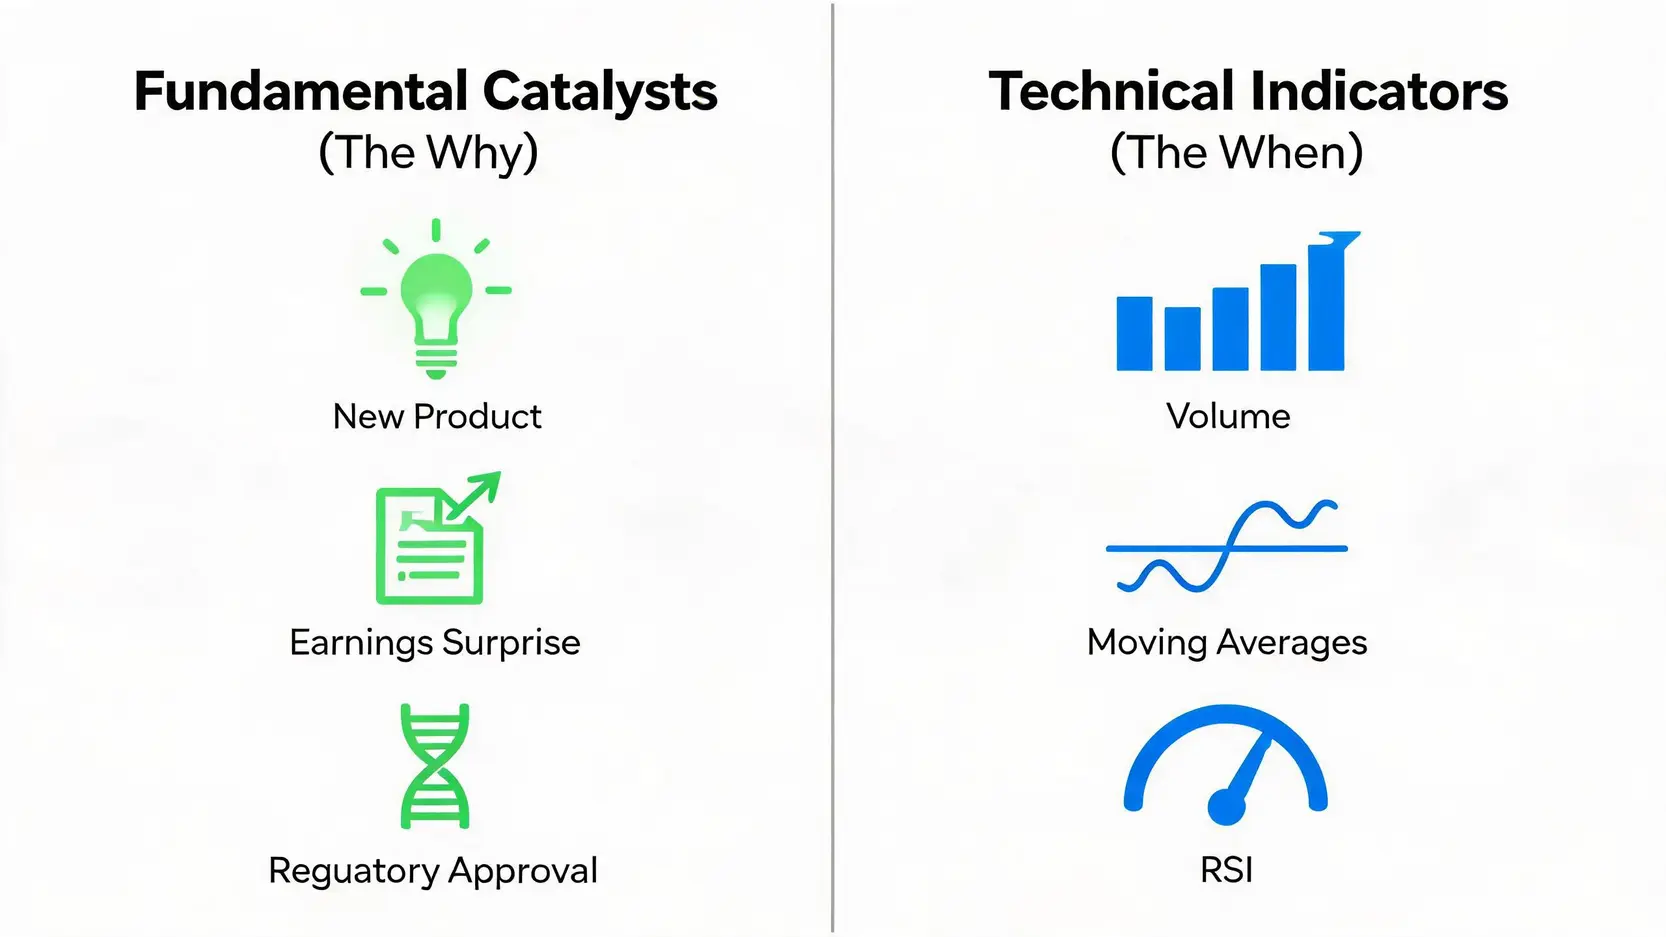
- Fundamental Catalysts: These are the ‘why’ behind the move. They are events or data points that change the market’s perception of a company’s future value. Examples include:
- Earnings Surprises: Revenue or profit figures that significantly beat analyst expectations.
- New Product or Technology Launches: The unveiling of a game-changing product that expands the company’s total addressable market.
- Regulatory Approvals: Positive news from government bodies, especially critical in sectors like biotechnology (e.g., FDA approval for a new drug).
- Mergers and Acquisitions (M&A): News of a company being acquired or making a strategic acquisition.
- Technical Indicators: These are the ‘when’ and ‘how’ of the move. They help confirm the strength and validity of a breakout. As detailed by financial authorities like Investopedia, key indicators include:
- Volume Confirmation: A spike in trading volume is arguably the most crucial confirmation signal. A breakout on low volume is often a red flag for a ‘false breakout’ or bull trap.
- Moving Averages: A stock breaking above its 50-day and 200-day moving averages is a classic bullish signal, indicating both short-term and long-term momentum are aligning.
- Relative Strength Index (RSI): While an RSI above 70 indicates overbought conditions, a strong breakout will often see the RSI push decisively into this territory, confirming powerful momentum.
- Bollinger Bands®: A price ‘walking the upper band’ after a breakout suggests sustained buying pressure and a strong trend.
2026 Market Outlook: Is the Nasdaq 100 Primed for Growth?
The 2026 economic landscape presents a complex but potentially rewarding environment for Nasdaq 100 investors. After a period of taming inflation, central banks are now in a delicate balancing act, influencing capital flows and sector valuations. Understanding this macro picture is essential for forecasting tech stock performance.
Macro-Economic Factors Influencing Tech Stocks in 2026
Several global economic forces are shaping the investment climate. Interest rate policy remains a primary driver; even a stable rate environment, following a hiking cycle, can be seen as a net positive for growth-oriented tech stocks, which are sensitive to the cost of capital. Furthermore, ongoing geopolitical shifts and supply chain recalibrations continue to create both challenges and opportunities. Companies with resilient operations and diverse global footprints are better positioned to thrive. The U.S. dollar’s strength also plays a significant role, impacting the overseas earnings of the multinational giants that dominate the Nasdaq 100.
Key Sector Trends Driving the Index: AI, Biotech, and Beyond
The narrative of the Nasdaq 100 in 2026 is being written by a few powerful, secular trends. These are not fleeting fads but long-term structural shifts in the economy.
- 🤖 Artificial Intelligence: AI is no longer a futuristic concept but a primary driver of corporate capital expenditure and earnings growth. The focus has shifted from foundational models to real-world applications and enterprise-level monetization.
- 🧬 Biotechnology: Advances in gene-editing technologies like CRISPR and the use of AI in drug discovery are accelerating innovation. Companies making breakthroughs in personalized medicine and oncology are attracting significant investment.
- ☁️ Cloud & Cybersecurity: The migration to cloud infrastructure is nearly universal, and the increasing sophistication of cyber threats makes cybersecurity a non-negotiable expense for businesses, ensuring a consistent growth runway for leading firms in these spaces.
Top Nasdaq 100 Breakout Candidates for 2026 (A Sector-by-Sector Analysis)
While we avoid direct investment advice, a sector-based analysis helps identify where breakout potential is highest. The key is to find companies with both strong fundamentals and charts that are coiling for a potential move.
Contenders in Artificial Intelligence & Semiconductors
The semiconductor industry remains the backbone of the AI revolution. In 2026, the leaders are not just the designers of high-end GPUs but also companies involved in specialized AI accelerators, advanced packaging, and memory technologies like HBM (High-Bandwidth Memory). A potential breakout candidate in this space would be a company that has secured a major design win with a cloud hyperscaler or is demonstrating a technological leap that puts it ahead of competitors. Look for stocks consolidating near all-time highs after a strong earnings report—a classic sign of accumulation before the next leg up.
Innovators in Cloud Computing & Enterprise Software
The major cloud providers continue to be dominant forces, but the most explosive growth opportunities may lie with enterprise software companies that are successfully integrating generative AI into their platforms. A breakout candidate here could be a mid-cap software-as-a-service (SaaS) company that has just reported accelerating revenue growth driven by a new AI-powered product tier. These companies often see significant multiple expansion as the market prices in a new, higher-growth future. Technically, this often manifests as a breakout from a multi-month ‘base’ or consolidation pattern.
Pioneers in Biotechnology and Healthcare Tech
Biotech is a high-risk, high-reward sector, but breakouts here can be spectacular. They are almost always event-driven. A company receiving positive Phase 3 trial data for a blockbuster drug or an unexpected FDA approval can see its stock price gap up significantly overnight. While harder to predict, investors can position themselves by watching companies with promising drug pipelines and strong balance sheets. A breakout from a long-term downtrend, confirmed by high volume, could signal that the market is beginning to price in future success.
A Practical Guide to Identifying Breakout Opportunities Yourself
Arming yourself with the right tools and analytical framework is key to independently finding the next wave of Nasdaq 100 breakout stocks. It transforms investing from a passive activity to a proactive search for opportunity.
Using Stock Screeners to Find Potential Breakouts
Stock screeners are powerful tools that allow you to filter thousands of stocks down to a manageable list based on specific criteria. To hunt for breakouts, you can set up a screen with a combination of technical and fundamental filters:
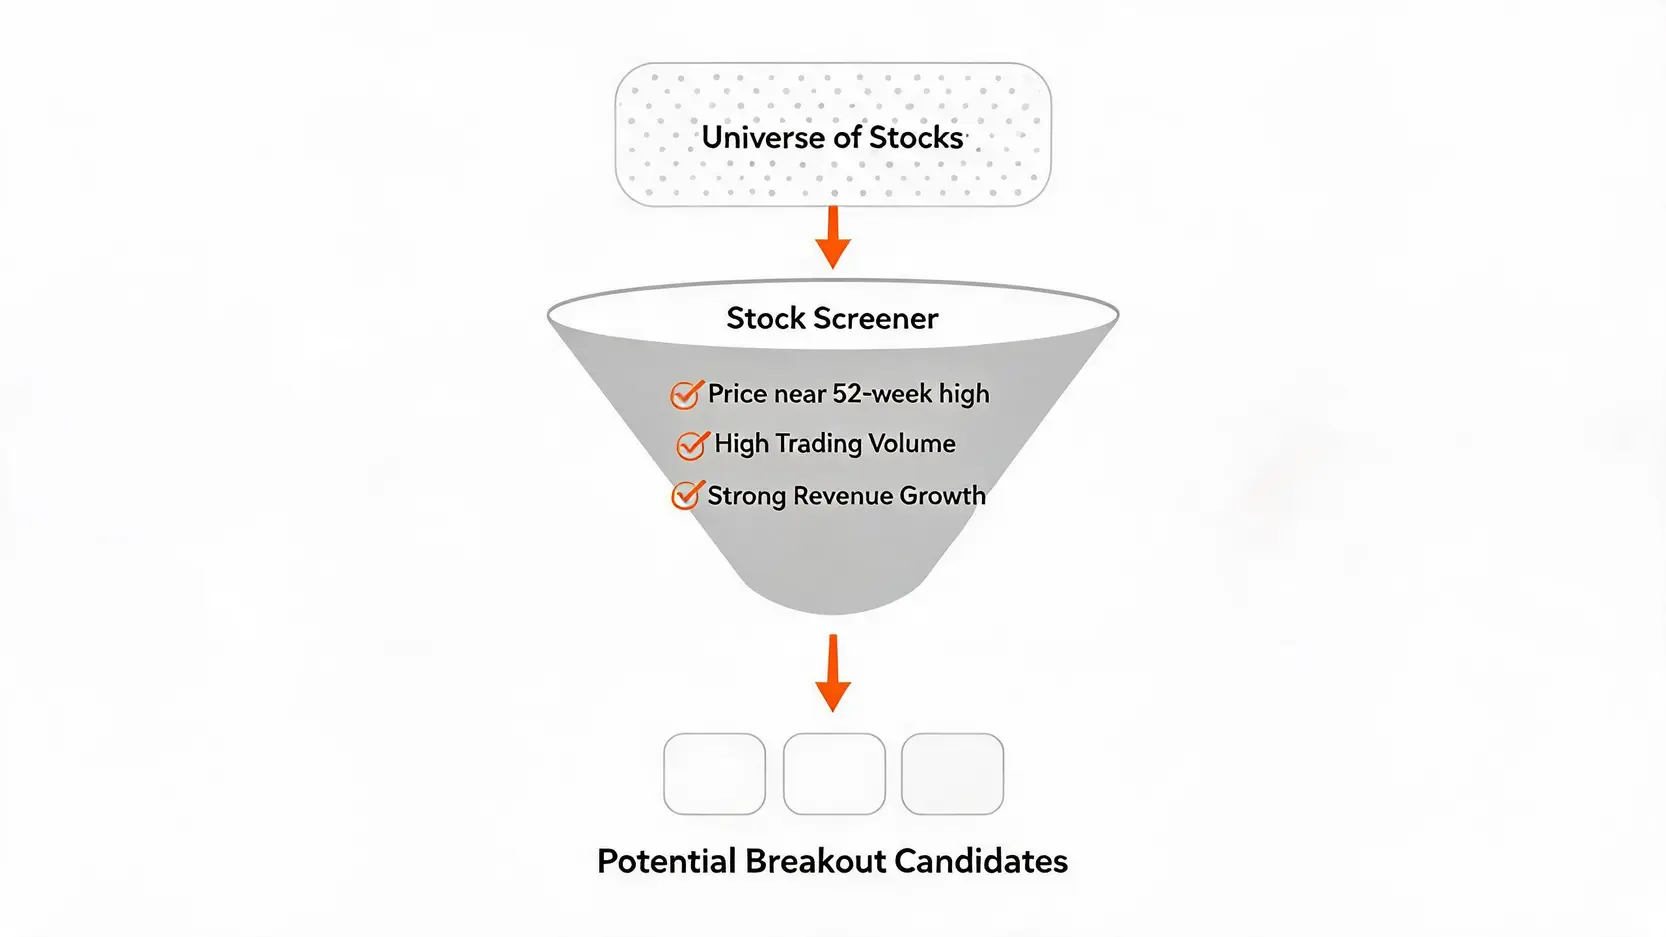
- Technical Criteria:
- Price within 5% of its 52-week high.
- Price above its 50-day moving average.
- Average daily volume greater than 500,000 shares (to ensure liquidity).
- Relative Strength Index (RSI) between 50 and 70 (strong but not yet overbought).
- Fundamental Criteria:
- Quarter-over-quarter revenue growth > 15%.
- Positive earnings per share (EPS) growth over the last year.
This type of screen will yield a list of fundamentally strong companies that are exhibiting strong technical momentum, providing a fertile ground for further research.
Key Metrics to Analyze Before Investing
Once your screener provides a list of candidates, the deep-dive analysis begins. Look beyond the chart and scrutinize the company’s financial health and valuation:
- Earnings Growth and Surprises: Is the company consistently beating earnings estimates? A history of positive surprises is a strong indicator of quality management and a robust business model.
- Profit Margins: Are gross and net profit margins stable or expanding? Expanding margins suggest the company has pricing power and operational efficiency.
- Valuation: While breakout stocks are rarely ‘cheap’, their valuation must be justifiable. Analyze the Price/Earnings-to-Growth (PEG) ratio. A PEG ratio around 1.0 can suggest that the stock’s price is reasonably valued relative to its expected earnings growth.
- Debt Load: Examine the debt-to-equity ratio. A company with low debt has more financial flexibility to invest in growth and weather economic downturns.
Managing the Risks: How to Avoid ‘False Breakouts’
The pursuit of high-growth breakout stocks is not without its perils. A ‘false breakout’ (or ‘bull trap’) occurs when a stock moves above a resistance level only to quickly reverse, trapping eager buyers. A disciplined risk management strategy is your primary defense.
Setting Stop-Losses and Profit Targets
A non-negotiable rule of breakout trading is to use stop-losses. An entry should be made as the stock breaks out, and a stop-loss order should be placed just below the former resistance level. This level has now theoretically become support. If the price falls back below it, the breakout has failed, and the position is closed for a small, manageable loss. Conversely, establish a profit target based on a favorable risk/reward ratio. If you are risking 5% on a trade, a logical first profit target might be at a 10% or 15% gain, ensuring that your winning trades are significantly larger than your losing ones.
The Importance of Diversification in a High-Growth Portfolio
Even with a robust strategy, concentrating your entire portfolio in a handful of high-momentum tech stocks is a high-risk approach. Diversification remains a cornerstone of prudent portfolio management. Spreading your capital across different breakout candidates in various sectors (e.g., semiconductors, software, biotech) can mitigate company-specific risk. If one stock suffers a negative catalyst, its impact on your overall portfolio is cushioned by the performance of others.
Conclusion
In conclusion, identifying Nasdaq 100 breakout stocks for 2026 requires a sophisticated, multi-faceted approach that blends rigorous technical analysis with deep fundamental research and an astute awareness of prevailing market trends. By concentrating on dominant sectors like AI, cloud computing, and biotech, and employing a disciplined, systematic process for screening and analysis, investors can significantly enhance their ability to uncover powerful growth opportunities. However, the potential for high returns must always be balanced with a disciplined risk management framework. Conducting thorough due diligence, utilizing stop-losses, and maintaining a diversified portfolio are essential to successfully capitalizing on the immense potential of the market’s next leaders.
Frequently Asked Questions (FAQ)
Q: What is the difference between a breakout stock and a growth stock?
A: While there is overlap, the terms are not interchangeable. A ‘growth stock’ refers to a company whose revenues and earnings are expected to grow at an above-average rate compared to the overall market. A ‘breakout stock’ is a technical definition referring to a stock whose price has just moved past a key level of resistance. Often, a growth stock will experience multiple breakouts during its long-term uptrend, but a breakout can also occur in a value stock that has been out of favor and is beginning a new cycle.
Q: How can I confirm a stock breakout is legitimate?
A: Confirmation is key to avoiding false breakouts. The single most important confirmation signal is a significant surge in trading volume—ideally, at least 1.5 to 2 times the 50-day average volume. Another strong signal is a ‘retest and hold’. This is when the stock price pulls back to the old resistance level (which should now act as support) and then bounces off it, confirming that buyers are now in control at that price.
Q: Are breakout stocks suitable for long-term investors?
A: Yes, they can be. For long-term investors, a breakout can serve as an ideal entry point into a fundamentally strong growth stock that is beginning a new phase of market leadership. A long-term investor might use a breakout from a multi-year consolidation pattern as a signal to initiate a position, with the intention of holding it for years, provided the company’s fundamental growth story remains intact.
Q: What role does market sentiment play in Nasdaq 100 breakouts?
A: Market sentiment plays a massive role. During a bull market with high investor confidence (a ‘risk-on’ environment), breakouts are more likely to be successful and lead to sustained follow-through. Conversely, in a fearful or bearish market (‘risk-off’), breakouts are more prone to failure as sellers quickly emerge to take profits. Therefore, assessing the overall health of the Nasdaq 100 index itself is a crucial step before trading an individual stock breakout.
Q: How long does a typical breakout trend last?
A: There is no set duration. The length of the ensuing trend depends entirely on the power of the underlying catalyst and the strength of the market. A breakout driven by a quarterly earnings beat might fuel a trend that lasts for several weeks. A breakout driven by a revolutionary new technology, like the advent of generative AI, can initiate a super-cycle trend that lasts for many months or even years.