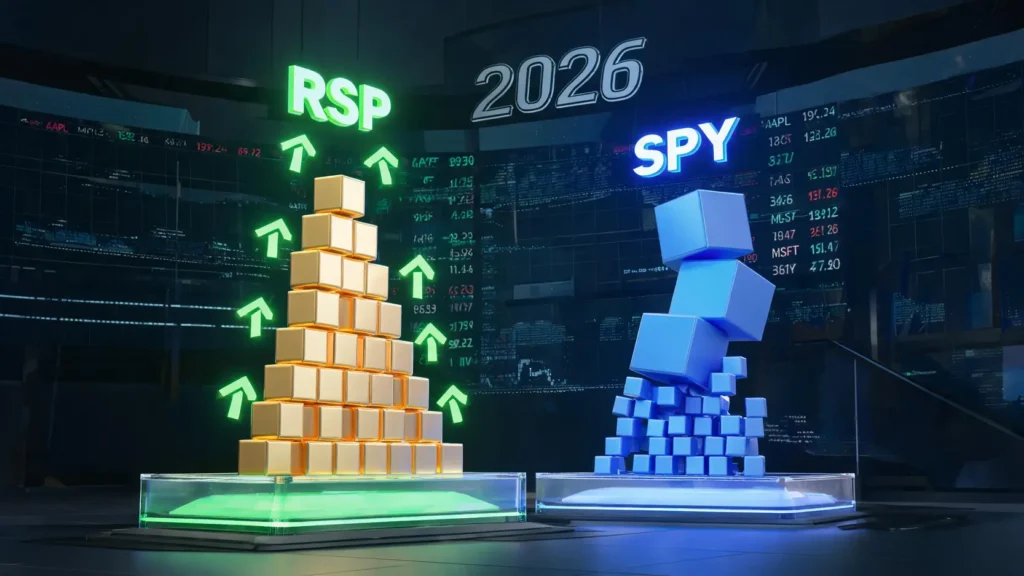
Are the days of mega-cap dominance fading? As we navigate 2026, many investors are noticing a significant shift: RSP outperforming SPY. With changing market dynamics and a broadening rally, understanding the mechanics behind the equal-weight vs. cap-weighted S&P 500 indices is crucial for protecting and growing your portfolio this year. The contrast between these two ETF investing strategies is becoming a defining narrative for the current financial landscape.
Table of Contents
Understanding the Basics: RSP vs. SPY
To grasp why the equal-weight S&P 500 is currently taking the lead, it is essential to define the core structural differences between these two prominent investment vehicles.
What is SPY (Cap-Weighted S&P 500)?
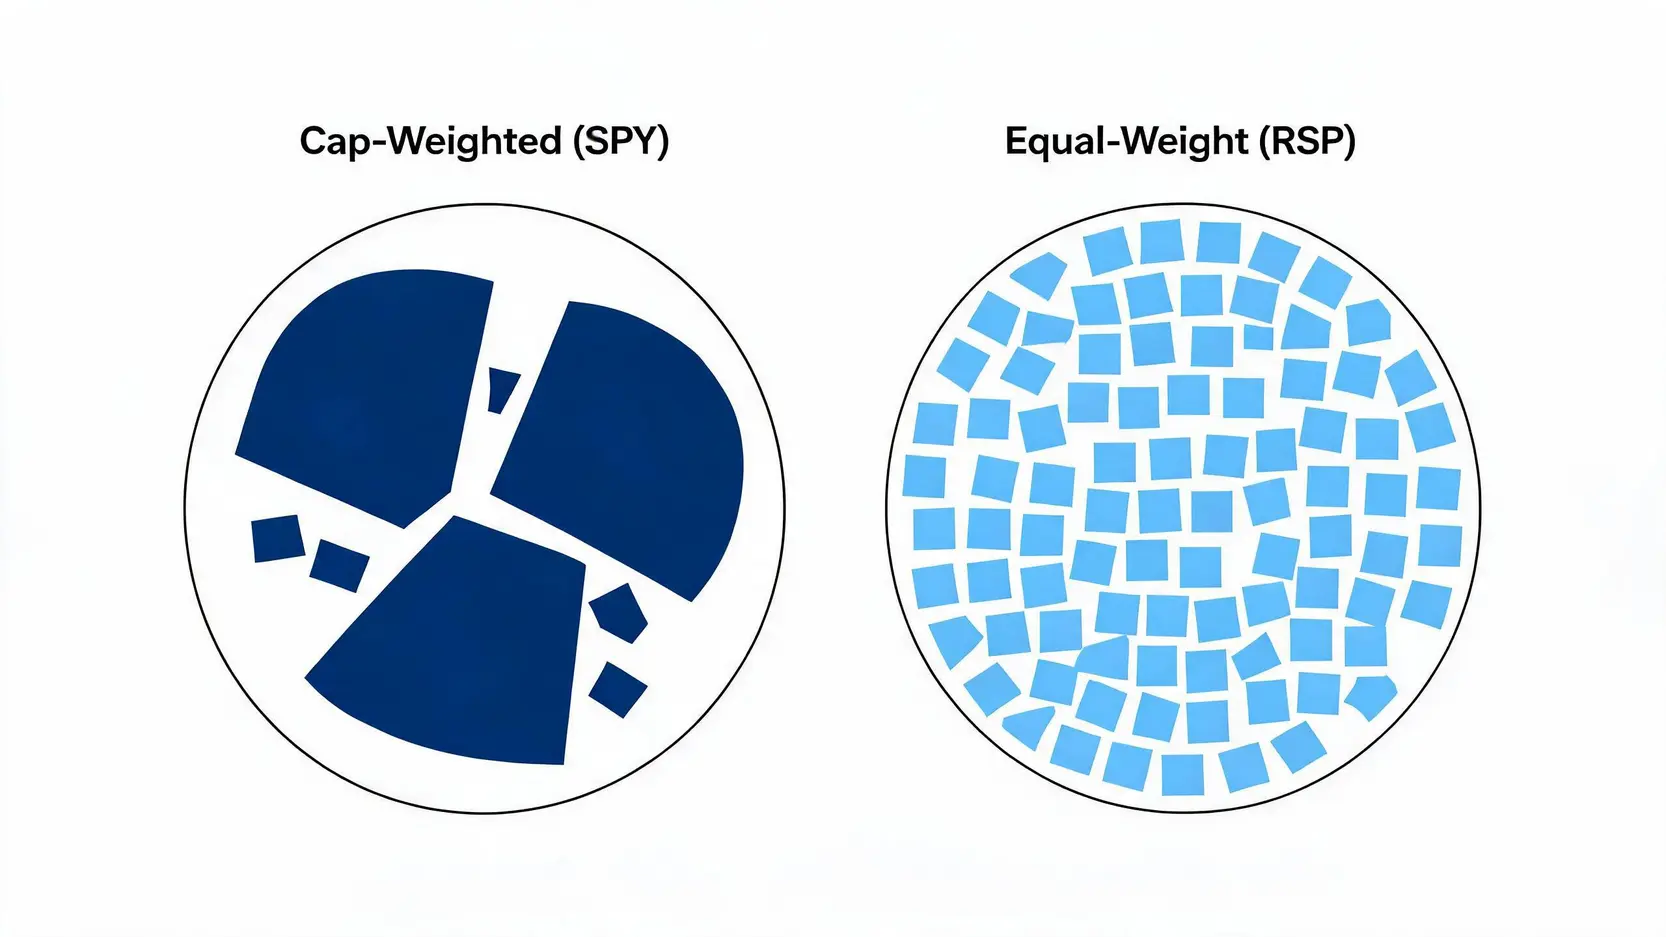
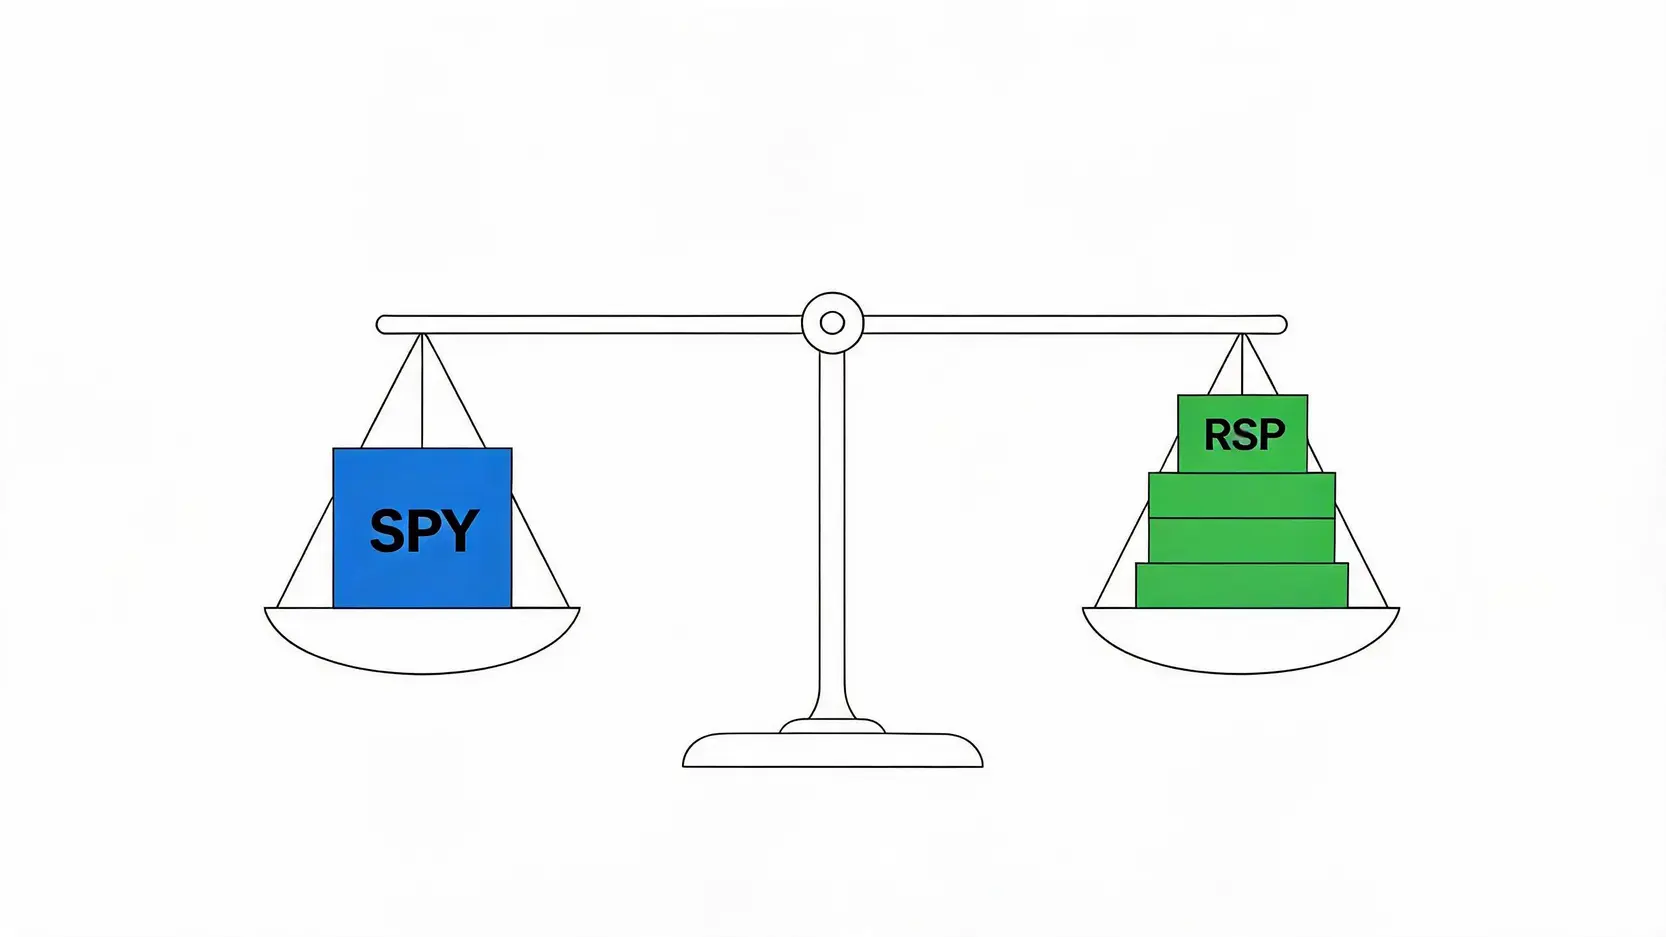
The SPDR S&P 500 ETF Trust (SPY) is a market-capitalization-weighted index fund. This means the largest companies in the index—predominantly tech giants—exert the most significant influence on its overall performance. When mega-cap stocks surge, SPY follows suit rapidly. However, this structure also introduces concentration risk; if the top five or ten companies stumble, the entire index feels the impact disproportionately.
What is RSP (Equal-Weight S&P 500)?
Conversely, the Invesco S&P 500 Equal Weight ETF (RSP) assigns the same weight (approximately 0.2%) to every company in the S&P 500, regardless of their market capitalization. This structure inherently mandates buying low and selling high during its quarterly rebalancing process. It provides broader exposure across the entire market spectrum, reducing reliance on a handful of tech behemoths and offering a more balanced view of corporate America’s health.
Key Drivers Behind RSP Outperforming SPY in 2026
The phenomenon of RSP outperforming SPY in 2026 is not merely a statistical anomaly; it is driven by fundamental shifts in macroeconomic conditions and market sentiment.
The Broadening Market Rally and Sector Rotation
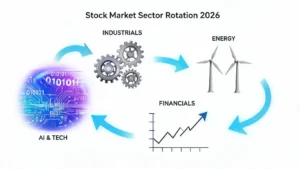
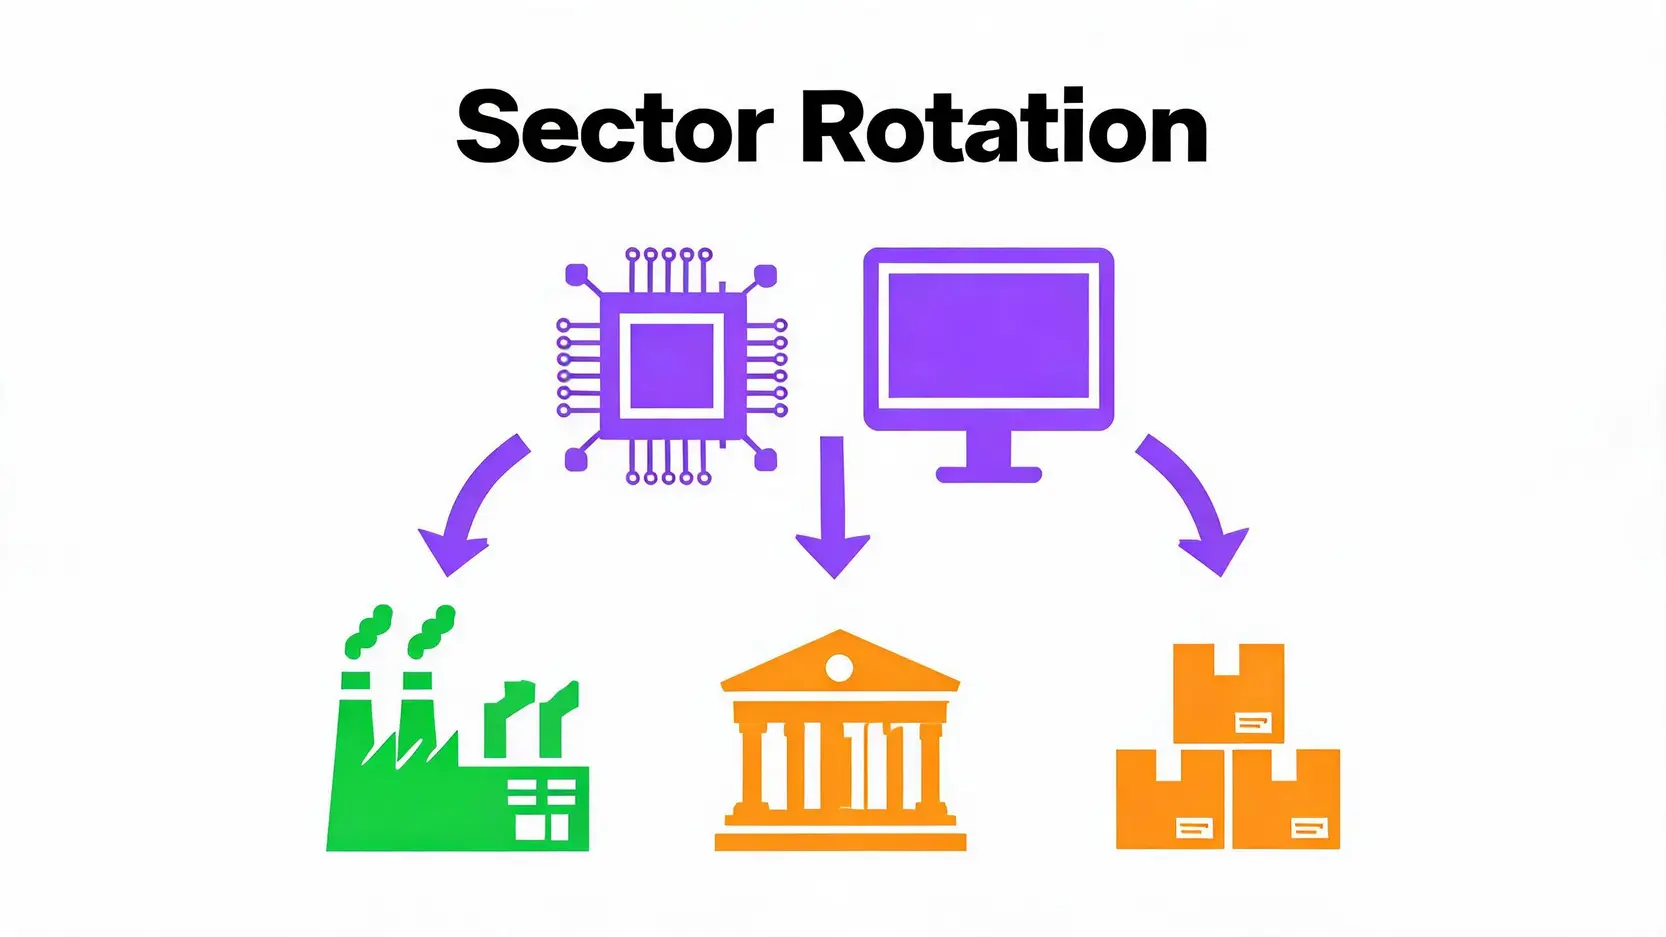
Earlier in the decade, market gains were heavily concentrated in the technology sector. However, 2026 has witnessed a pronounced broadening of the market rally. Sectors that previously lagged, such as industrials, financials, and materials, are now experiencing robust growth. Because RSP allocates equal capital to these sectors, it captures this widespread economic expansion more effectively than the cap-weighted SPY. This sector rotation indicates a healthier, more resilient broader market.
Stumbling Mega-Caps and AI Fatigue
Another crucial factor is the relative fatigue among mega-cap technology stocks. After years of explosive, AI-driven growth, valuations for these market leaders have become stretched. Investors are increasingly seeking more attractively valued opportunities outside the top ten stocks. As capital flows out of the heavily weighted tech sector and into the remaining 490 companies of the S&P 500, RSP naturally benefits, pulling ahead of its cap-weighted counterpart.
Hidden Opportunities: Sector Deep Dive for 2026
Analyzing the performance gap between the equal-weight and cap-weighted indices reveals hidden opportunities within the broader market landscape.
Value and Dividend Stocks Making a Comeback
The current environment favors value over pure growth. The equal-weight methodology inherently tilts toward value, as it systematically trims winners and buys underperformers during rebalancing. This has positioned RSP to capitalize on the resurgence of dividend-paying and fundamentally solid companies that were overlooked during the tech boom. This value tilt provides a degree of insulation during periods of market volatility.
Mid-Cap Exposure and Lower Concentration Risk
By weighting the smallest company in the S&P 500 the same as the largest, RSP provides significant exposure to mid-cap fundamentals. Historically, smaller companies possess higher growth potential compared to saturated mega-caps. Furthermore, this structure dramatically lowers concentration risk, protecting capital if the tech sector experiences a sharp correction. Understanding ETF investing strategies involves recognizing how to mitigate these specific risks.
How to Strategically Allocate Between RSP and SPY Now
Strategic allocation requires evaluating current market conditions against long-term objectives. For investors heavily concentrated in technology, initiating or increasing a position in RSP offers a prudent diversification mechanism. Conversely, those seeking aggressive growth might still retain SPY but utilize RSP to anchor the portfolio. Blending the two approaches can smooth out volatility while still capturing overall market upside.
Conclusion
To summarize, the trend of RSP outperforming SPY in 2026 highlights a vital shift from tech-heavy concentration to broader market health. By strategically balancing both ETFs, investors can mitigate risks while capturing upside potential. Evaluate your portfolio’s tech exposure today to ensure you are well-positioned for the rest of the year.
Frequently Asked Questions
Why is RSP suddenly beating SPY in 2026?
RSP is outperforming due to a broadening market rally where capital is rotating out of overvalued mega-cap tech stocks and into previously neglected sectors like financials, industrials, and mid-cap equities, which hold a larger proportional weight in RSP.
Is RSP a safer investment than SPY during a recession?
RSP reduces concentration risk, meaning a massive failure in a few top companies won’t devastate the fund as much as it would SPY. However, because it has higher exposure to mid-cap and cyclical stocks, it can still experience significant volatility during an economic downturn.
Should I sell my SPY shares to buy RSP?
A complete liquidation is rarely necessary. A more measured approach involves rebalancing your portfolio. If your current allocation is heavily skewed toward tech through SPY, directing new capital toward RSP can help achieve a more balanced and diversified equity exposure.
What is the expense ratio difference between RSP and SPY?
Historically, equal-weight ETFs like RSP tend to have slightly higher expense ratios than ultra-low-cost cap-weighted funds like SPY, due to the increased trading costs associated with quarterly rebalancing. Always check the current prospectus for exact figures.