Is the Coppock Curve good for swing trading? Yes—but only when it is used as a trend filter rather than a standalone entry signal.
Because the indicator was built for longer-term momentum analysis, it often reacts too slowly for short-term trade timing on its own. Its real value lies in helping traders identify the broader market direction first, then using faster tools such as price action, RSI, or MACD to refine entries and exits.
In practice, the Coppock Curve tends to work best in trending markets and on higher timeframes, which is why many swing traders use it for context, not for direct execution.
Table of Contents
Why the Coppock Curve Was Not Originally Built for Swing Trading
The reason Coppock Curve good for swing trading remains a debated topic is simple: the indicator was not designed for short-term trade timing. Edwin Coppock created it to identify major market bottoms on long-term charts, so its standard settings are built for slower momentum analysis rather than frequent swing-trading signals.
That long-term design explains why is Coppock Curve good for swing trading often depends on how it is used. As a direct entry or exit tool, the Coppock Curve is usually too slow. By the time a signal appears, a large part of the move may already be over, which weakens its value for short-term execution.
Why Some Swing Traders Still Use It
Even so, using the Coppock Curve for swing trading can still be useful when it acts as a trend filter rather than a timing trigger. On a weekly chart, it helps traders identify whether the broader market bias is bullish or bearish before using faster tools on the daily chart.
This is where the Coppock Curve in swing trading adds value. It filters out short-term noise and gives traders a cleaner view of the dominant trend, which can reduce overtrading and improve trade selection.
When Coppock Curve Works Well for Swing Trading
The Coppock Curve works best in trending markets, especially after a major correction when momentum begins to recover. In that setting, a rising weekly reading can support bullish swing setups and help traders align with the broader market direction.
This is the strongest argument for Coppock Curve good for swing trading, particularly on indices, major ETFs, and other liquid assets where price trends are smoother and less distorted by sudden event risk. In practice, many traders combine the weekly Coppock Curve with daily-chart tools such as RSI, MACD, price action, or support and resistance.
When Coppock Curve Performs Poorly
The indicator performs poorly in sideways or range-bound markets. In those conditions, the Coppock Curve can hover around the zero line and produce signals that arrive late or fail quickly. This is one of the main reasons is Coppock Curve good for swing trading cannot be answered with a simple yes.
It also tends to be less effective on highly volatile, news-driven individual stocks. Sharp earnings reactions or event-driven price swings can overwhelm the slow momentum logic behind the indicator, making using the Coppock Curve for swing trading much less reliable.
Best Way to Use Coppock Curve in a Swing Strategy
The most effective method involves a multi-timeframe approach where the Coppock Curve defines the strategic direction and other tools pinpoint the tactical entry. This disciplined, step-by-step process ensures traders align themselves with the dominant market momentum, significantly improving the probability of success.
- Step 1: Define the Macro Trend with the Weekly Coppock Curve. Start with the weekly chart. If the Coppock Curve is above zero, the broader bias is bullish; if it is below zero, the trend is weaker or bearish. This is why traders asking is the Coppock Curve good for swing trading often use it as a trend filter, not an entry tool.
- Step 2: Pinpoint Entry with Daily Price Action or an Oscillator. Once the weekly trend is bullish, switch to the daily chart for execution. Use faster tools such as price action, support retests, or RSI above 50 instead of the daily Coppock Curve. This is usually the most effective way of using the Coppock Curve for swing trading.
- Step 3: Implement Strict Risk Management. Always define risk before entering. Stops are usually placed below the recent swing low or a key support level, while targets can be based on resistance or a minimum 1:2 risk-reward ratio. This is essential if you want to judge whether the Coppock Curve is good for swing trading in real trading conditions.
Coppock Curve vs. MACD for Swing Trading
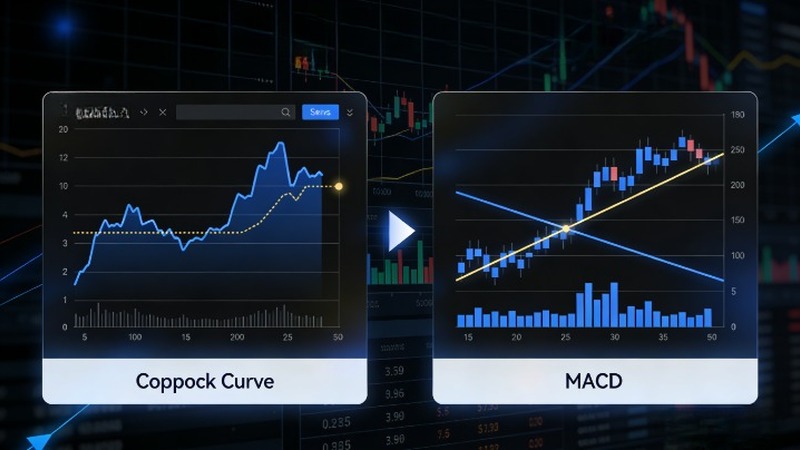
A direct comparison reveals that the MACD (Moving Average Convergence Divergence) is generally faster and more suited for signal generation, while the Coppock Curve excels as a slower, more reliable trend filter. Understanding their distinct characteristics is key to deciding which tool to use, or how to combine them, in a swing trading strategy.
| Feature | Coppock Curve | MACD |
| Speed | Lagging. Very slow due to its long-term Rate of Change and WMA inputs. | Leading/Coincident. Much faster as it is based on shorter-term exponential moving averages. |
| Signal Type | Primary signal is the zero-line cross, indicating major momentum shifts. | Multiple signals: zero-line cross, signal line crossover, and histogram divergence. |
| Best Use Case for Swing Trading | As a weekly trend filter to establish a directional bias (e.g., only take long trades when weekly Coppock > 0). | As a daily entry trigger (e.g., enter on a bullish signal line crossover) or to spot momentum divergence. |
| Primary Weakness | Generates very late signals in fast-moving markets and performs poorly in sideways conditions. | Can produce multiple false signals (‘whipsaws’) in choppy or range-bound markets. |
Common Mistakes Swing Traders Make
A common mistake is treating a zero-line cross as an immediate buy or sell signal. The Coppock Curve is a lagging indicator, so the cross should be read as a shift in trend context, not as a direct entry trigger. For traders asking is Coppock Curve good for swing trading, the better approach is to wait for confirmation from price action or faster indicators.
Another mistake is ignoring volume, chart structure, and risk control. A Coppock signal is usually stronger when it aligns with rising volume, a clear breakout, or a bullish price pattern. Without that confirmation, and without a defined stop-loss, using the Coppock Curve for swing trading becomes much less reliable.
Conclusion
The answer to “is Coppock Curve good for swing trading?” is yes—but only as a trend filter, not as a standalone timing tool. Its real strength is showing the dominant market direction on higher timeframes, which helps traders stay aligned with the broader trend.
Its weakness is timing. Because the indicator is slow and lagging, it is usually not effective for precise entries or exits on its own. In practice, using the Coppock Curve for swing trading works best when it defines market bias, while price action, volume, RSI, or MACD handle execution.